Dec 10, JDN 2458098
Take a look at this graph of manufacturing output per worker-hour:
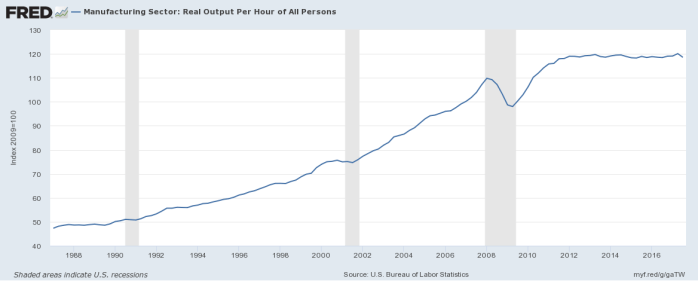
From 1988 to 2008, it was growing at a steady pace. In 2008 and 2009 it took a dip due to the Great Recession; no big surprise there. But then since 2012 it has been… completely flat. If we take this graph at face value, it would imply that manufacturing workers today can produce no more output than workers five years ago, and indeed only about 10% more than workers a decade ago. Whereas, a worker in 2008 was producing over 60% more than a worker in 1998, who was producing over 40% more than a worker in 1988.
Many economists call this the “productivity paradox”, and use it to argue that we don’t really need to worry about robots taking all our jobs any time soon. I think this view is mistaken.
The way we measure productivity is fundamentally wrongheaded, and is probably the sole cause of this “paradox”.
First of all, we use total hours scheduled to work, not total hours actually doing productive work. This is obviously much, much easier to measure, which is why we do it. But if you think for a moment about how the 40-hour workweek norm is going to clash with rapidly rising real productivity, it becomes apparent why this isn’t going to be a good measure.
When a worker finds a way to get done in 10 hours what used to take 40 hours, what does that worker’s boss do? Send them home after 10 hours because the job is done? Give them a bonus for their creativity? Hardly. That would be far too rational. They assign them more work, while paying them exactly the same. Recognizing this, what is such a worker to do? The obvious answer is to pretend to work the other 30 hours, while in fact doing something more pleasant than working.
And indeed, so-called “worker distraction” has been rapidly increasing. People are right to blame smartphones, I suppose, but not for the reasons they think. It’s not that smartphones are inherently distracting devices. It’s that smartphones are the cutting edge of a technological revolution that has made most of our work time unnecessary, so due to our fundamentally defective management norms they create overwhelming incentives to waste time at work to avoid getting drenched in extra tasks for no money.
That would probably be enough to explain the “paradox” by itself, but there is a deeper reason that in the long run is even stronger. It has to do with the way we measure “output”.
It might surprise you to learn that economists almost never consider output in terms of the actual number of cars produced, buildings constructed, songs written, or software packages developed. The standard measures of output are all in the form of so-called “real GDP”; that is, the dollar value of output produced.
They do adjust for indexes of inflation, but as I’ll show in a moment this still creates a fundamentally biased picture of the productivity dynamics.
Consider a world with only three industries: Housing, Food, and Music.
Productivity in Housing doesn’t change at all. Producing a house cost 10,000 worker-hours in 1950, and cost 10,000 worker-hours in 2000. Nominal price of houses has rapidly increased, from $10,000 in 1950 to $200,000 in 2000.
Productivity in Food rises moderately fast. Producing 1,000 meals cost 1,000 worker-hours in 1950, and cost 100 worker-hours in 2000. Nominal price of food has increased slowly, from $1,000 per 1,000 meals in 1950 to $5,000 per 1,000 meals in 2000.
Productivity in Music rises extremely fast. Producing 1,000 performances cost 10,000 worker-hours in 1950, and cost 1 worker-hour in 2000. Nominal price of music has collapsed, from $100,000 per 1,000 performances in 1950 to $1,000 per 1,000 performances in 2000.
This is of course an extremely stylized version of what has actually happened: Housing has gotten way more expensive, food has stayed about the same in price while farm employment has plummeted, and the rise of digital music has brought about a new Renaissance in actual music production and listening while revenue for the music industry has collapsed. There is a very nice Vox article on the “productivity paradox” showing a graph of how prices have changed in different industries.
How would productivity appear in the world I’ve just described, by standard measures? Well, to say that I actually need to say something about how consumers substitute across industries. But I think I’ll be forgiven in this case for saying that there is no substitution whatsoever; you can’t eat music or live in a burrito. There’s also a clear Maslow hierarchy here: They say that man cannot live by bread alone, but I think living by Led Zeppelin alone is even harder.
Consumers will therefore choose like this: Over 10 years, buy 1 house, 10,000 meals, and as many performances as you can afford after that. Further suppose that each person had $2,100 per year to spend in 1940-1950, and $50,000 per year to spend in 1990-2000. (This is approximately true for actual nominal US GDP per capita.)
1940-1950:
Total funds: $21,000
1 house = $10,000
10,000 meals = $10,000
Remaining funds: $1,000
Performances purchased: 10
1990-2000:
Total funds: $500,000
1 house = $200,000
10,000 meals = $50,000
Remaining funds: $250,000
Performances purchased: 250,000
(Do you really listen to this much music? 250,000 performances over 10 years is about 70 songs per day. If each song is 3 minutes, that’s only about 3.5 hours per day. If you listen to music while you work or watch a couple of movies with musical scores, yes, you really do listen to this much music! The unrealistic part is assuming that people in 1950 listen to so little, given that radio was already widespread. But if you think of music as standing in for all media, the general trend of being able to consume vastly more media in the digital age is clearly correct.)
Now consider how we would compute a price index for each time period. We would construct a basket of goods and determine the price of that basket in each time period, then adjust prices until that basket has a constant price.
Here, the basket would probably be what people bought in 1940-1950: 1 house, 10,000 meals, and 400 music performances.
In 1950, this basket cost $10,000+$10,000+$100 = $21,000.
In 2000, this basket cost $200,000+$50,000+$400 = $150,400.
This means that our inflation adjustment is $150,400/$21,000 = 7 to 1. This means that we would estimate the real per-capita GDP in 1950 at about $14,700. And indeed, that’s about the actual estimate of real per-capita GDP in 1950.
So, what would we say about productivity?
Sales of houses in 1950 were 1 per person, costing 10,000 worker hours.
Sales of food in 1950 were 10,000 per person, costing 10,000 worker hours.
Sales of music in 1950 were 400 per person, costing 4,000 worker hours.
Worker hours per person are therefore 24,000.
Sales of houses in 2000 were 1 per person, costing 10,000 worker hours.
Sales of food in 2000 were 10,000 per person, costing 1,000 worker hours.
Sales of music in 2000 were 250,000 per person, costing 25,000 worker hours.
Worker hours per person are therefore 36,000.
Therefore we would estimate that productivity rose from $14,700/24,000 = $0.61 per worker-hour to $50,000/36,000 = $1.40 per worker-hour. This is an annual growth rate of about 1.7%, which is again, pretty close to the actual estimate of productivity growth. For such a highly stylized model, my figures are doing remarkably well. (Honestly, better than I thought they would!)
But think about how much actual productivity rose, at least in the industries where it did.
We produce 10 times as much food per worker hour after 50 years, which is an annual growth rate of 4.7%, or three times the estimated growth rate.
We produce 10,000 times as much music per worker hour after 50 years, which is an annual growth rate of over 20%, or almost twelve times the estimated growth rate.
Moreover, should music producers be worried about losing their jobs to automation? Absolutely! People simply won’t be able to listen to much more music than they already are, so any continued increases in music productivity are going to make musicians lose jobs. And that was already allowing for music consumption to increase by a factor of over 600.
Of course, the real world has a lot more industries than this, and everything is a lot more complicated. We do actually substitute across some of those industries, unlike in this model.
But I hope I’ve gotten at least the basic point across that when things become drastically cheaper as technological progress often does, simply adjusting for inflation doesn’t do the job. One dollar of music today isn’t the same thing as one dollar of music a century ago, even if you inflation-adjust their dollars to match ours. We ought to be measuring in hours of music; an hour of music is much the same thing as an hour of music a century ago.
And likewise, that secretary/weather forecaster/news reporter/accountant/musician/filmmaker in your pocket that you call a “smartphone” really ought to be counted as more than just a simple inflation adjustment on its market price. The fact that it is mind-bogglingly cheaper to get these services than it used to be is the technological progress we care about; it’s not some statistical artifact to be removed by proper measurement.
Combine that with actually measuring the hours of real, productive work, and I think you’ll find that productivity is still rising quite rapidly, and that we should still be worried about what automation is going to do to our jobs.
