Apr 6 JDN 2460772
I was only able to find sufficient data to calculate the Index of Necessary Expenditure back to 1990. But I found a fairly consistent pattern that the INE grew at a rate about 20% faster than the CPI over that period, so I decided to take a look at what longer-term income growth looks like if we extrapolate that pattern back further in time.
The result is this graph:

Using the CPI, real per-capita GDP in the US (in 2024 dollars) has grown from $25,760 in 1950 to $85,779 today—increasing by a factor of 3.33. Even accounting for increased inequality and the fact that more families have two income earners, that’s still a substantial increase.
But using the extrapolated INE, real per-capita GDP has only grown from $43,622 in 1950 to $85,779 today—increasing by only a factor of 1.97. This is a much smaller increase, especially when we adjusted for increased inequality and increased employment for women.
Even without the extrapolation, it’s still clear that real INE-adjusted incomes have were basically stagnant in the 2000s, increased rather slowly in the 2020s, and then actually dropped in 2022 after a bunch of government assistance ended. What looked, under the CPI, like steadily increasing real income was actually more like treading water.
Should we trust this extrapolation? It’s a pretty simplistic approach, I admit. But I think it is plausible when we consider this graph of the ratio between median income and median housing price:
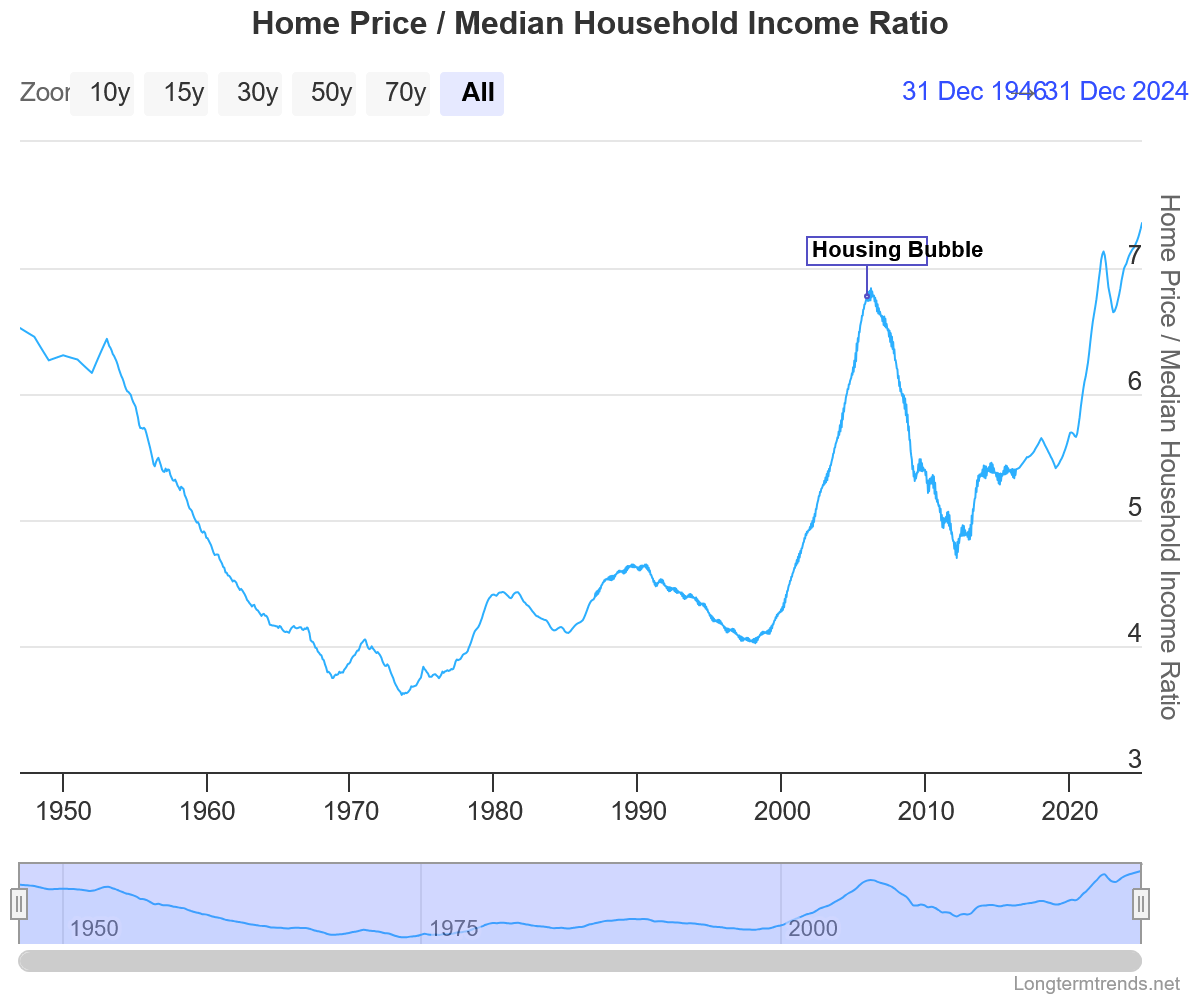
This ratio was around 6 in the 1950s, then began to fall until in the 1970s it stabilized around 4. It began to slowly creep back up, but then absolutely skyrocketed in the 2000s before the 2008 crash. Now it has been rising again, and is now above 7, the highest it has been since the Second World War. (Does this mean we’re due for another crash? I’d bet as much.)
What does this mean? It means that a typical family used to be able to afford a typical house with only four years of their total income—and now would require seven. In that sense, homes are now 75% more expensive today than they were in the 1970s.
Similar arguments can be made for the rising costs of education and healthcare; while many prices have not grown much (gasoline) or even fallen (jewelry and technology), these necessities have continued to grow more and more expensive, not simply in nominal terms, but even compared to the median income.
This is further evidence that our standard measures of “inflation” and “real income” are fundamentally inadequate. They simply aren’t accurately reflecting the real cost of living for most American families. Even in many times when it seemed “inflation” was low and “real income” was growing, in fact it was growing harder and harder to afford vital necessities such as housing, education, and healthcare.
This economic malaise may have been what contributed to the widespread low opinion of Biden’s economy. While the official figures looked good, people’s lives weren’t actually getting better.
Yet this is still no excuse for those who voted for Trump; even the policies he proudly announced he would do—like tariffs and deportations—have clearly made these problems worse, and this was not only foreseeable but actually foreseen by the vast majority of the world’s economists. Then there are all the things he didn’t even say he would do but is now doing, like cozying up to Putin, alienating our closest allies, and discussing “methods” for achieving an unconstitutional third term.
Indeed, it honestly feels quite futile to even reflect upon what was wrong with our economy even when things seemed to be running smoothly, because now things are rapidly getting worse, and showing no sign of getting better in any way any time soon.
