The stochastic overload model
Mar 12 JDN 2460016
The next few posts are going to be a bit different, a bit more advanced and technical than usual. This is because, for the first time in several months at least, I am actually working on what could be reasonably considered something like theoretical research.
I am writing it up in the form of blog posts, because actually writing a paper is still too stressful for me right now. This also forces me to articulate my ideas in a clearer and more readable way, rather than dive directly into a morass of equations. It also means that even if I do never actually get around to finishing a paper, the idea is out there, and maybe someone else could make use of it (and hopefully give me some of the credit).
I’ve written previously about the Yerkes-Dodson effect: On cognitively-demanding tasks, increased stress increases performance, but only to a point, after which it begins decreasing it again. The effect is well-documented, but the mechanism is poorly understood.
I am currently on the wrong side of the Yerkes-Dodson curve, which is why I’m too stressed to write this as a formal paper right now. But that also gave me some ideas about how it may work.
I have come up with a simple but powerful mathematical model that may provide a mechanism for the Yerkes-Dodson effect.
This model is clearly well within the realm of a behavioral economic model, but it is also closely tied to neuroscience and cognitive science.
I call it the stochastic overload model.
First, a metaphor: Consider an engine, which can run faster or slower. If you increase its RPMs, it will output more power, and provide more torque—but only up to a certain point. Eventually it hits a threshold where it will break down, or even break apart. In real engines, we often include safety systems that force the engine to shut down as it approaches such a threshold.
I believe that human brains function on a similar principle. Stress increases arousal, which activates a variety of processes via the sympathetic nervous system. This activation improves performance on both physical and cognitive tasks. But it has a downside; especially on cognitively demanding tasks which required sustained effort, I hypothesize that too much sympathetic activation can result in a kind of system overload, where your brain can no longer handle the stress and processes are forced to shut down.
This shutdown could be brief—a few seconds, or even a fraction of a second—or it could be prolonged—hours or days. That might depend on just how severe the stress is, or how much of your brain it requires, or how prolonged it is. For purposes of the model, this isn’t vital. It’s probably easiest to imagine it being a relatively brief, localized shutdown of a particular neural pathway. Then, your performance in a task is summed up over many such pathways over a longer period of time, and by the law of large numbers your overall performance is essentially the average performance of all your brain systems.
That’s the “overload” part of the model. Now for the “stochastic” part.
Let’s say that, in the absence of stress, your brain has a certain innate level of sympathetic activation, which varies over time in an essentially chaotic, unpredictable—stochastic—sort of way. It is never really completely deactivated, and may even have some chance of randomly overloading itself even without outside input. (Actually, a potential role in the model for the personality trait neuroticism is an innate tendency toward higher levels of sympathetic activation in the absence of outside stress.)
Let’s say that this innate activation is x, which follows some kind of known random distribution F(x).
For simplicity, let’s also say that added stress s adds linearly to your level of sympathetic activation, so your overall level of activation is x + s.
For simplicity, let’s say that activation ranges between 0 and 1, where 0 is no activation at all and 1 is the maximum possible activation and triggers overload.
I’m assuming that if a pathway shuts down from overload, it doesn’t contribute at all to performance on the task. (You can assume it’s only reduced performance, but this adds complexity without any qualitative change.)
Since sympathetic activation improves performance, but can result in overload, your overall expected performance in a given task can be computed as the product of two terms:
[expected value of x + s, provided overload does not occur] * [probability overload does not occur]
E[x + s | x + s < 1] P[x + s < 1]
The first term can be thought of as the incentive effect: Higher stress promotes more activation and thus better performance.
The second term can be thought of as the overload effect: Higher stress also increases the risk that activation will exceed the threshold and force shutdown.
This equation actually turns out to have a remarkably elegant form as an integral (and here’s where I get especially technical and mathematical):
\int_{0}^{1-s} (x+s) dF(x)
The integral subsumes both the incentive effect and the overload effect into one term; you can also think of the +s in the integrand as the incentive effect and the 1-s in the limit of integration as the overload effect.
For the uninitated, this is probably just Greek. So let me show you some pictures to help with your intuition. These are all freehand sketches, so let me apologize in advance for my limited drawing skills. Think of this as like Arthur Laffer’s famous cocktail napkin.
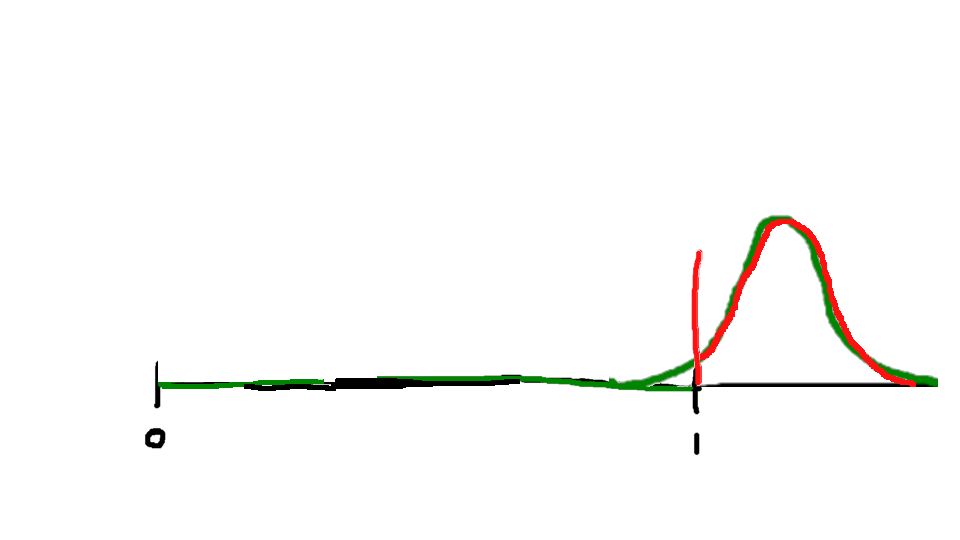
Suppose that, in the absence of outside stress, your innate activation follows a distribution like this (this could be a normal or logit PDF; as I’ll talk about next week, logit is far more tractable):

As I start adding stress, this shifts the distribution upward, toward increased activation:

Initially, this will improve average performance.
But at some point, increased stress actually becomes harmful, as it increases the probability of overload.

And eventually, the probability of overload becomes so high that performance becomes worse than it was with no stress at all:
The result is that overall performance, as a function of stress, looks like an inverted U-shaped curve—the Yerkes-Dodson curve:
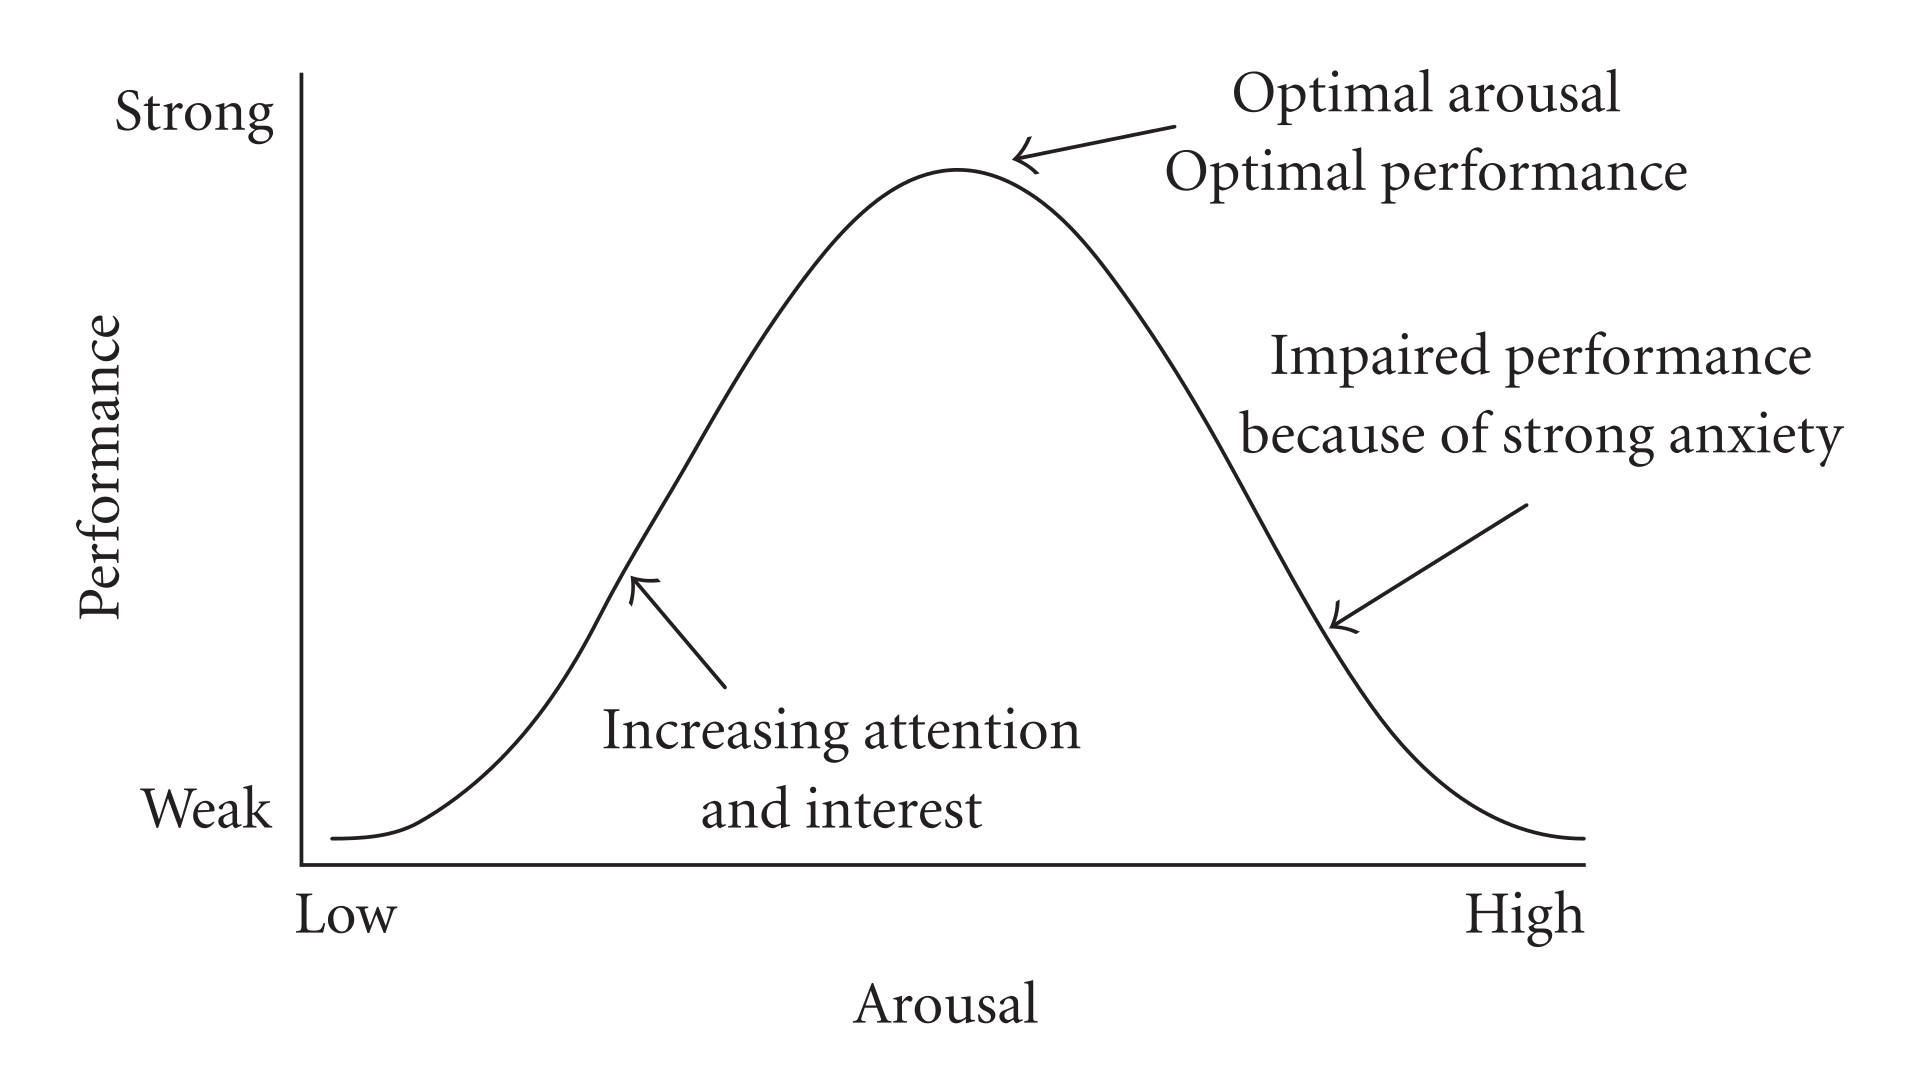
The precise shape of this curve depends on the distribution that we use for the innate activation, which I will save for next week’s post.

[…] posts ago I introduced my stochastic overload model, which offers an explanation for the Yerkes-Dodson effect by positing that additional stress […]
LikeLike
[…] couple weeks ago I presented my stochastic overload model, which posits a neurological mechanism for the Yerkes-Dodson effect: Stress increases sympathetic […]
LikeLike
[…] understood. It may be a general pattern of neural hyper-activation, not unlike what I posit in my stochastic overload model. The stereotypical nerd wears glasses, and, yes, indeed, myopia is also correlated with […]
LikeLike
Thank you
LikeLike
[…] stress becomes harmful rather than helpful. This is the Yerkes-Dodson effect, for which I developed my stochastic overload model (which I still don’t know if I’ll ever publish, ironically enough, because of my own […]
LikeLike
[…] not”, “definitely not”. (This is essentially my categorical prospect theory, which, like the stochastic overload model, is a half-baked theory that I haven’t published and at this point probably never […]
LikeLike