Mar 26 JDN 2460030
Two posts ago I introduced my stochastic overload model, which offers an explanation for the Yerkes-Dodson effect by positing that additional stress increases sympathetic activation, which is useful up until the point where it starts risking an overload that forces systems to shut down and rest.
The central equation of the model is actually quite simple, expressed either as an expectation or as an integral:
Y = E[x + s | x + s < 1] P[x + s < 1]
Y = \int_{0}^{1-s} (x+s) dF(x)
The amount of output produced is the expected value of innate activation plus stress activation, times the probability that there is no overload. Increased stress raises this expectation value (the incentive effect), but also increases the probability of overload (the overload effect).
The model relies upon assuming that the brain starts with some innate level of activation that is partially random. Exactly what sort of Yerkes-Dodson curve you get from this model depends very much on what distribution this innate activation takes.
I’ve so far solved it for three types of distribution.
The simplest is a uniform distribution, where within a certain range, any level of activation is equally probable. The probability density function looks like this:
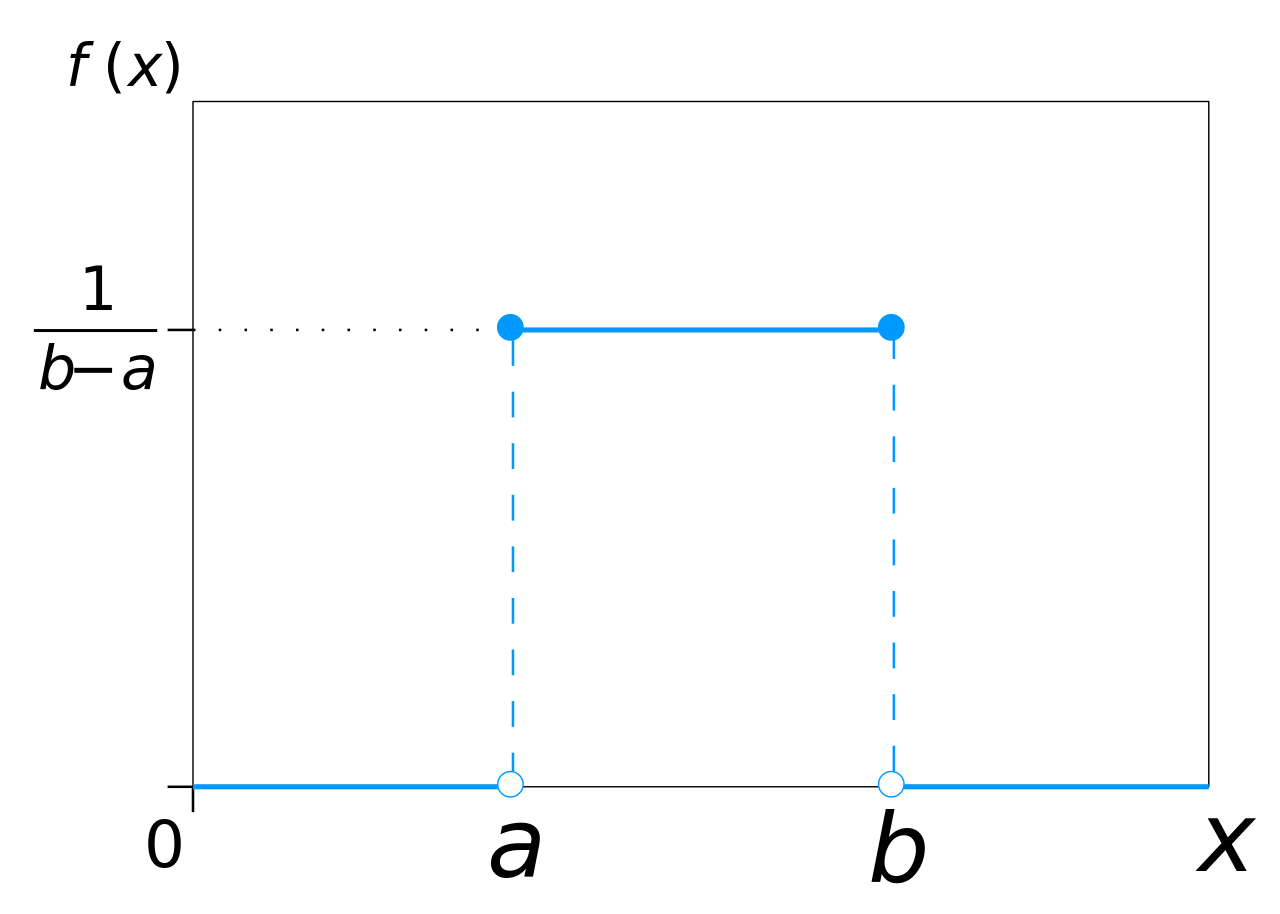
Assume the distribution has support between a and b, where a < b.
When b+s < 1, then overload is impossible, and only the incentive effect occurs; productivity increases linearly with stress.
The expected output is simply the expected value of a uniform distribution from a+s to b+s, which is:
E[x + s] = (a+b)/2+s
Then, once b+s > 1, overload risk begins to increase.
In this range, the probability of avoiding overload is:
P[x + s < 1] = F(1-s) = (1-s-a)/(b-a)
(Note that at b+s=1, this is exactly 1.)
The expected value of x+s in this range is:
E[x + s | x + s < 1] = (1-s)(1+s)/(2(b-a))
Multiplying these two together:
Y = [(1-s)(1+s)(1-s-a)]/[2(b-a)^2]
Here is what that looks like for a=0, b=1/2:
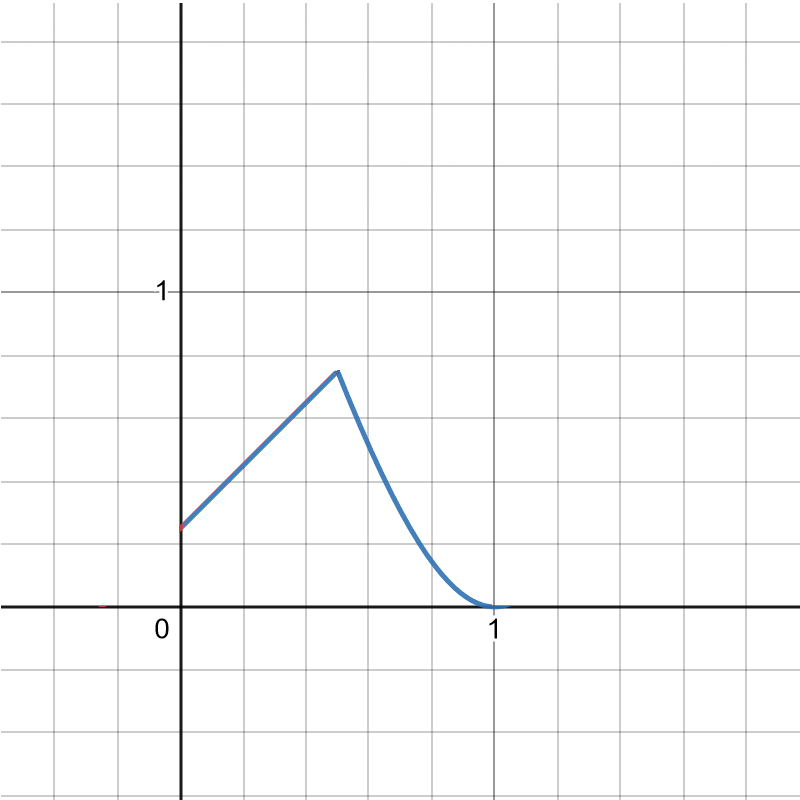
It does have the right qualitative features: increasing, then decreasing. But its sure looks weird, doesn’t it? It has this strange kinked shape.
So let’s consider some other distributions.
The next one I was able to solve it for is an exponential distribution, where the most probable activation is zero, and then higher activation always has lower probability than lower activation in an exponential decay:

For this it was actually easiest to do the integral directly (I did it by integrating by parts, but I’m sure you don’t care about all the mathematical steps):
Y = \int_{0}^{1-s} (x+s) dF(x)
Y = (1/λ+s) – (1/ λ + 1)e^(-λ(1-s))
The parameter λdecides how steeply your activation probability decays. Someone with low λ is relatively highly activated all the time, while someone with high λ is usually not highly activated; this seems like it might be related to the personality trait neuroticism.
Here are graphs of what the resulting Yerkes-Dodson curve looks like for several different values of λ:
λ = 0.5:
λ = 1:

λ = 2:

λ = 4:

λ = 8:

The λ = 0.5 person has high activation a lot of the time. They are actually fairly productive even without stress, but stress quickly overwhelms them. The λ = 8 person has low activation most of the time. They are not very productive without stress, but can also bear relatively high amounts of stress without overloading.
(The low-λ people also have overall lower peak productivity in this model, but that might not be true in reality, if λ is inversely correlated with some other attributes that are related to productivity.)
Neither uniform nor exponential has the nice bell-curve shape for innate activation we might have hoped for. There is another class of distributions, beta distributions, which do have this shape, and they are sort of tractable—you need something called an incomplete beta function, which isn’t an elementary function but it’s useful enough that most statistical packages include it.
Beta distributions have two parameters, α and β. They look like this:

Beta distributions are quite useful in Bayesian statistics; if you’re trying to estimate the probability of a random event that either succeeds or fails with a fixed probability (a Bernoulli process), and so far you have observed a successes and b failures, your best guess of its probability at each trial is a beta distribution with α = a+1 and β = b+1.
For beta distributions with parameters α and β, the result comes out to (I is that incomplete beta function I mentioned earlier):
Y = I(1-s, α+1, β) + I(1-s, α, β)
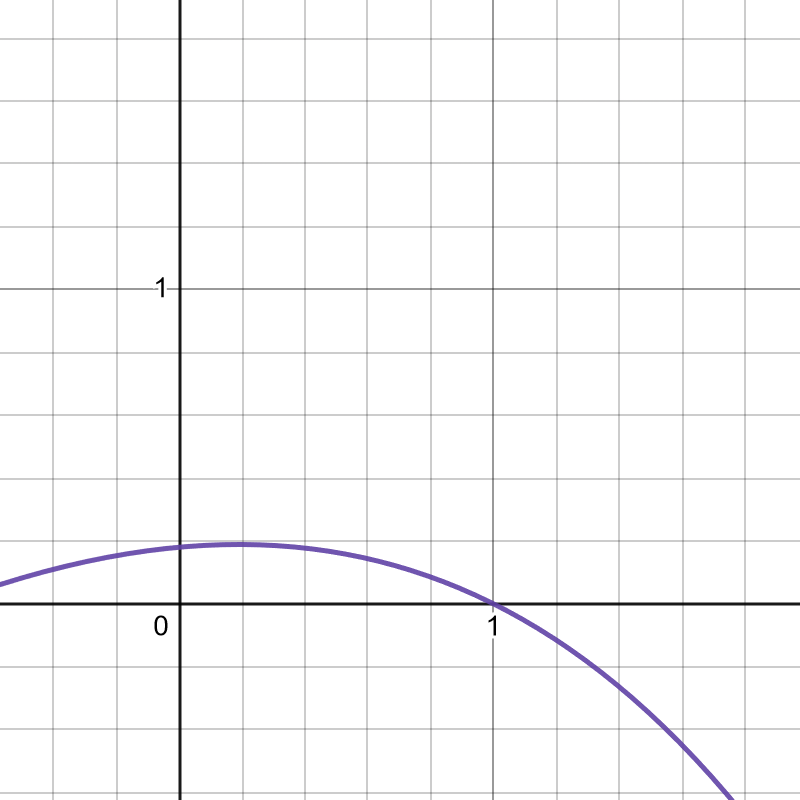
For whole number values of α andβ, the incomplete beta function can be computed by hand (though it is more work the larger they are); here’s an example with α = β = 2.
The innate activation probability looks like this:

And the result comes out like this:
Y = 2(1-s)^3 – 3/2(1-s)^4 + 3s(1-s)^2 – 2s(1-s)^3

This person has pretty high innate activation most of the time, so stress very quickly overwhelms them. If I had chosen a much higher β, I could change that, making them less likely to be innately so activated.
These are the cases I’ve found to be relatively tractable so far. They all have the right qualitative pattern: Increasing stress increases productivity for awhile, then begins decreasing it once overload risk becomes too high. They also show a general pattern where people who are innately highly activated (neurotic?) are much more likely to overload and thus much more sensitive to stress.
