Nov 15 JDN 2461360
While the results of this year’s elections were mostly very good, there is one outcome that disappointed me: California’s ballot measure to institute a wealth tax on billionaires narrowly failed. I was also quite surprised by this, because wealth taxes on billionaires seem to be, in general, a very popular policy, especially among Democrats, who form a strong majority of California’s population. (The New York Times tries to make this into some kind of referendum on progressive policies in general, which seems… oddly defeatist. Okay, we didn’t get this one, this time; but after winning this many elections, you’re saying our policy agenda is hopeless?)
Perhaps time will tell what happened here: Did many people simply not vote on the proposal? Did they not understand it? Were the extensive and well-funded ad campaigns against the proposal effective at convincing people to oppose it? I don’t know.
What I do know is that we clearly need to do something about wealth inequality in this country.
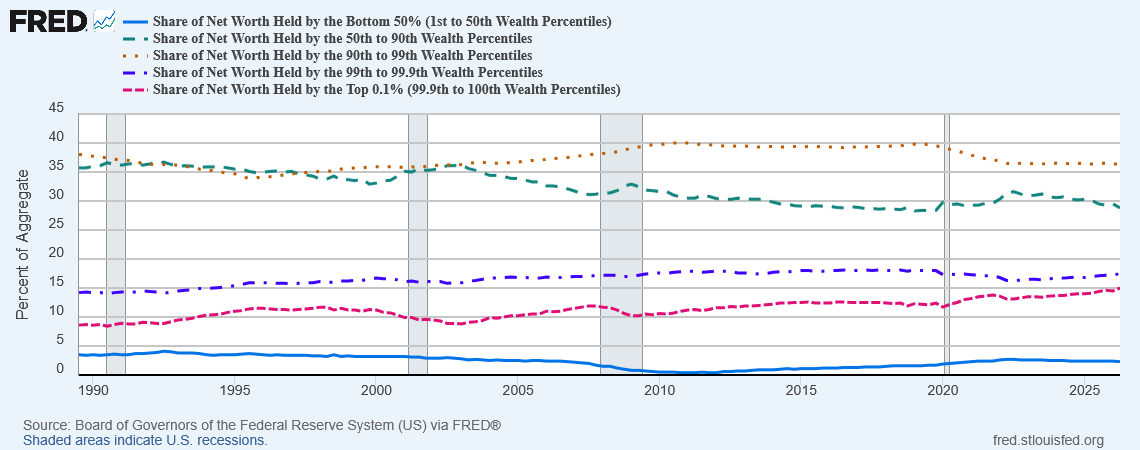
If you look at the proportion of wealth owned by the 50%-90% percentiles, which we might think of as the “upper middle class”, there is a steady decline, but the absolute numbers still don’t seem so bad:
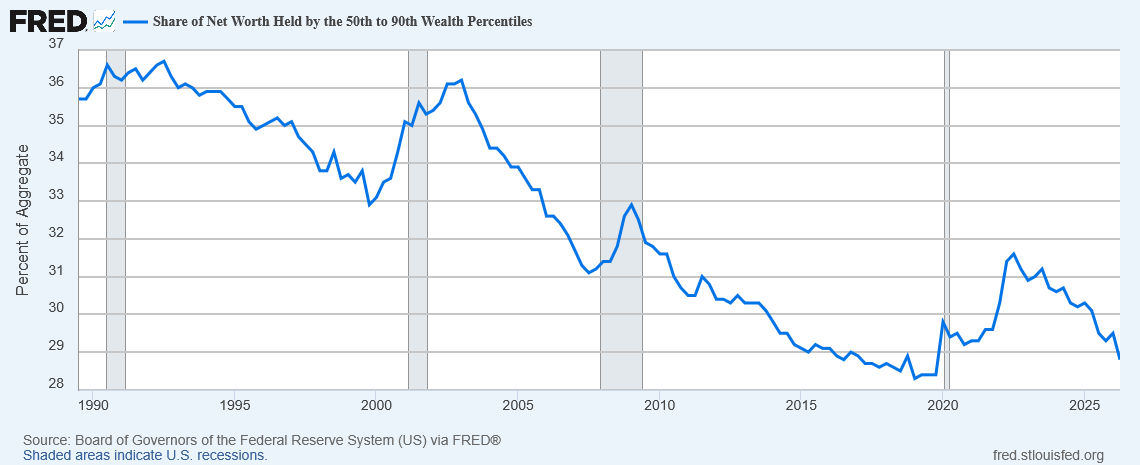
This group comprises 40% of the population, and in 1990 owned 36% of the wealth. Today, they own 29% of the wealth. That’s a definite decline, but 40% of people owning 29% of the wealth still doesn’t seem too unreasonable.
It’s when you look at the bottom 50%—everyone below the median wealth—that alarm bells start going off:
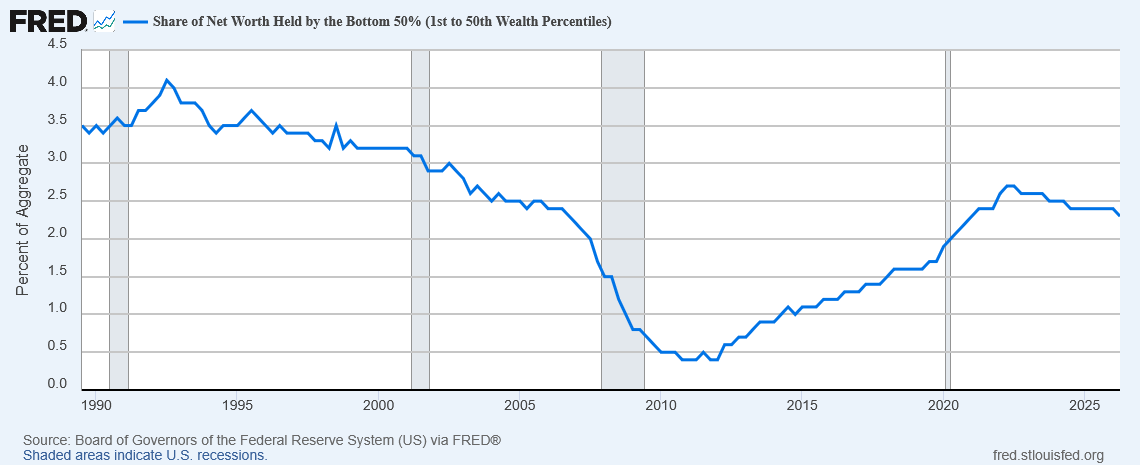
In 1990, this group—half the population, remember—owned only 3.5% of all US wealth. Today, it’s even worse: The lower half of the population owns only 2.5% of the wealth. And most of that is owned by the second quartile; the first quartile owns essentially zero net wealth—or even has negative net wealth.
What about the rich?
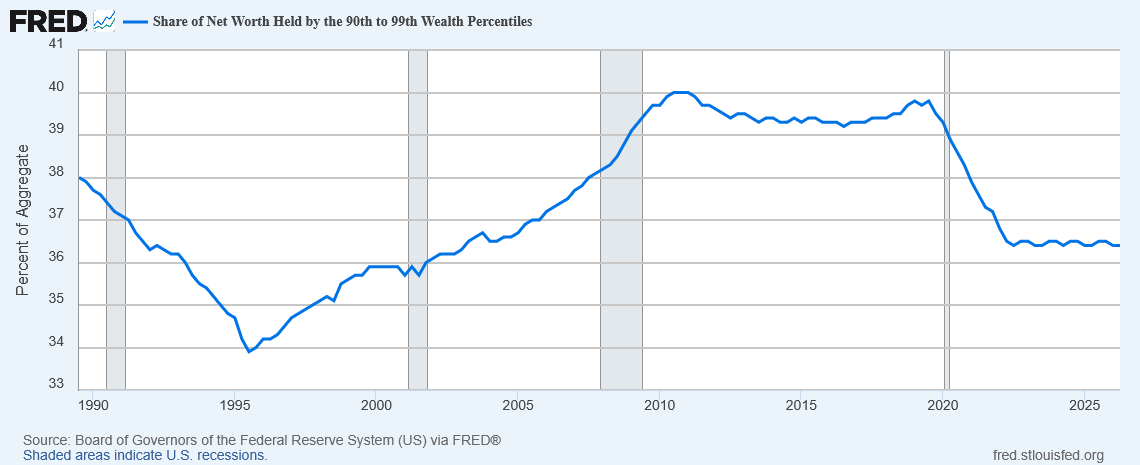
Well, what we might call the “merely rich”, the 90% to 99% percentiles, has been fairly stable in its wealth share, going from 38% of wealth in 1990 to 36.5% of wealth today. They comprise 9% of the population; so, roughly speaking, people in this group are about 4 times as wealthy as the average.
But then we get to the “very rich”, the top 1% excluding the top 0.1%, and we see a different story:
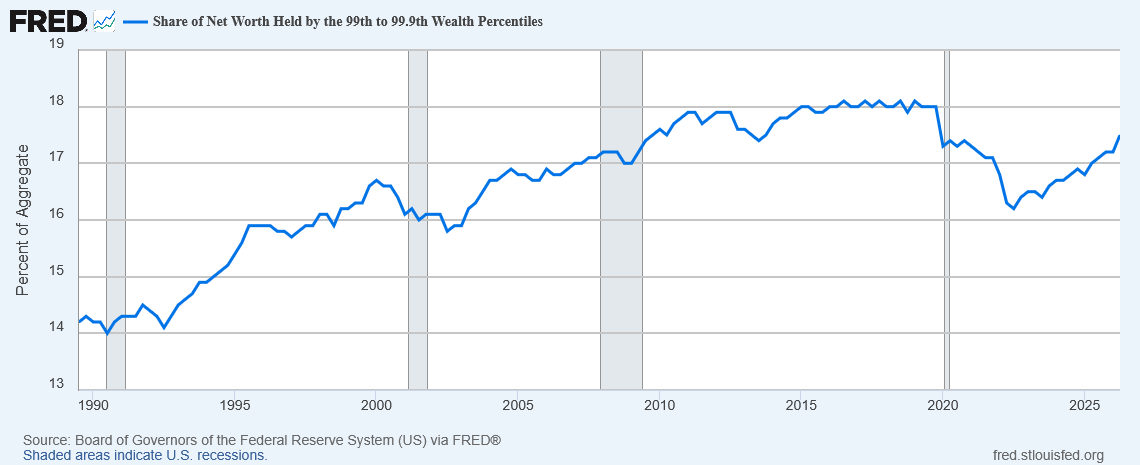
Their share of wealth has risen from 14% in 1990 to 17% today—and note that since they are only 1% of the population, this means they have gone from 14 times as rich as the average to 17 times as rich.
But even this is not the worst of our inequality. Finally, we come to the “super rich”, the top 0.1%, and the result is absolutely appalling:
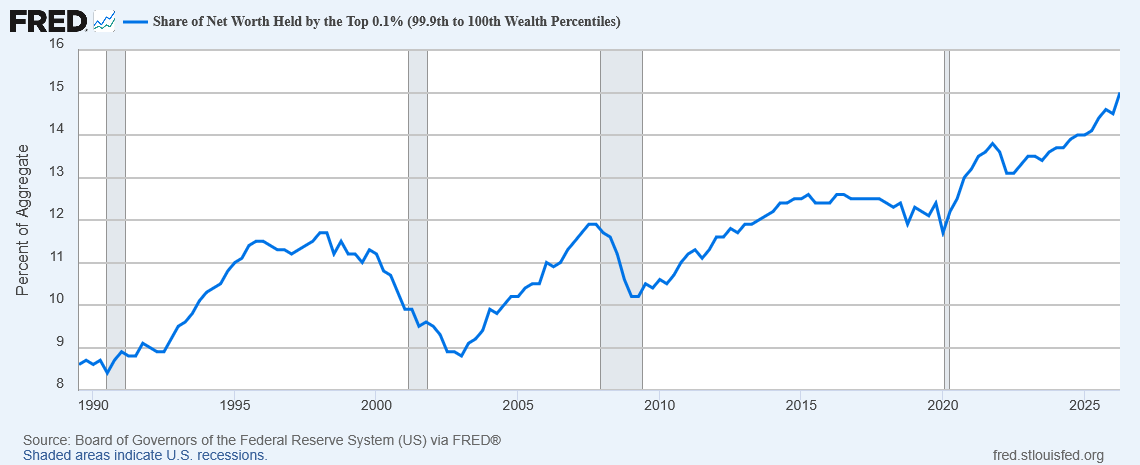
Their share of US wealth has risen from 9% in 1990—already much too high—to over 15% today. Since they are only 0.1% of the population, this means their wealth has risen from 90 times the average to 150 times the average.
Combining this with the fall in wealth for the bottom half of the distribution, we find that the ratio in average wealth between someone in the top 0.1% and someone in the bottom 50% has risen from an already-staggering 1,285 to an utterly horrifying 3,000. The average person in the top 0.1% now owns three thousand times as much wealth as the average person in the poorest half of our country.
Many economists will tell you we should only be concerned about how poor the poor are, nevermind how rich the rich are—but I think this is wrong. I think when the richest of the rich own this much of our society’s wealth, they also take on a disproportionate amount of the power by their ability to run ads, control media, and donate to political campaigns.
Indeed, I think it may turn out that the very reason the billionaire tax failed was because of this disproportionate power—that the very reason we need the billionaire tax is the reason it didn’t quite make it.

