Who still uses cash?

Feb 27 JDN 2459638

If you had to guess, what is the most common denomination of US dollar bills? You might check your wallet: $1? $20?

No, it’s actually $100. There are 13.1 billion $1 bills, 11.7 billion $20 bills, and 16.4 billion $100 bills. And since $100 bills are worth more, the vast majority of US dollar value in circulation is in those $100 bills—indeed, $1.64 trillion of the total $2.05 trillion cash supply.

This is… odd, to say the least. When’s the last time you spent a $100 bill? Then again, when’s the last time you spent… cash? In a typical week, 30% of Americans use no cash at all.

In the United States, cash is used for 26% of transactions, compared to 28% for debit card and 23% for credit cards. The US is actually a relatively cash-heavy country by First World standards. In the Netherlands and Scandinavia, cash is almost unheard of. When I last visited Amsterdam a couple of months ago, businesses were more likely to take US credit cards than they were to take cash euros.

A list of countries most reliant on cash shows mostly very poor countries, like Chad, Angola, and Burkina Faso. But even in Sub-Saharan Africa, mobile money is dominant in Botswana, Kenya and Uganda.

And yet the cash money supply is still quite large: $2.05 trillion is only a third of the US monetary base, but it’s still a huge amount of money. If most people aren’t using it, who is? And why is so much of it in the form of $100 bills?

It turns out that the answer to the second question can provide an answer to the first. $100 bills are not widely used for consumer purchases—indeed, most businesses won’t even accept them. (Honestly that has always bothered me: What exactly does “legal tender” mean, if you’re allowed to categorically refuse $100 bills? It’d be one thing to say “we can’t accept payment when we can’t make change”, and obviously nobody seriously expects you to accept $10,000 bills; but what if you have a $97 purchase?) When people spend cash, it’s mainly ones, fives, and twenties.

Who uses $100 bills? People who want to store money in a way that is anonymous, easily transportable—including across borders—and stable against market fluctuations. Drug dealers leap to mind (and indeed the money-laundering that HSBC did for drug cartels was largely in the form of thick stacks of $100 bills). Of course it isn’t just drug dealers, or even just illegal transactions, but it is mostly people who want to cross borders. 80% of US $100 bills are in circulation outside the United States. Since 80% of US cash is in the form of $100 bills, this means that nearly two-thirds of all US dollars are outside the US.

Knowing this, I have to wonder: Why does the Federal Reserve continue printing so many $100 bills? Okay, once they’re out there, it may be hard to get them back. But they do wear out eventually. (In fact, US dollars wear out faster than most currencies, because they are made of linen instead of plastic. Surprisingly, this actually makes them less eco-friendly despite being more biodegradable. Of course, the most eco-friendly method of payment is mobile payments, since their marginal environmental impact is basically zero.) So they could simply stop printing them, and eventually the global supply would dwindle.

They clearly haven’t done this—indeed, there were more $100 bills printed last year than any previous year, increasing the global supply by 2 billion bills, or $200 billion. Why not? Are they trying to keep money flowing for drug dealers? Even if the goal is to substitute for failing currencies in other countries (a somewhat odd, if altruistic, objective), wouldn’t that be more effective with $1 and $5 bills? $100 is a lot of money for people in Chad or Angola! Chad’s per-capita GDP is a staggeringly low $600 per year; that means that a $100 bill to a typical person in Chad would be like me holding onto a $10,000 bill (those exist, technically). Surely they’d prefer $1 bills—which would still feel to them like $100 bills feel to me. Even in middle-income countries, $100 is quite a bit; Ecuador actually uses the US dollar as its main currency, but their per-capita GDP is only $5,600, so $100 to them feels like $1000 to us.

If you want to usefully increase the money supply to stimulate consumer spending, print $20 bills—or just increase some numbers in bank reserve accounts. Printing $100 bills is honestly baffling to me. It seems at best inept, and at worst possibly corrupt—maybe they do want to support drug cartels?

How rich are we, really?

Oct 29, JDN 2458056

The most commonly-used measure of a nation’s wealth is its per-capita GDP, which is simply a total of all spending in a country divided by its population. More recently we adjust for purchasing power, giving us GDP per capita at purchasing power parity (PPP).

By this measure, the United States always does well. At most a dozen countries are above us, most of them by a small amount, and all of them are quite small countries. (For fundamental statistical reasons, we should expect both the highest and lowest average incomes to be in the smallest countries.)

But this is only half the story: It tells us how much income a country has, but not how that income is distributed. We should adjust for inequality.

How can we do this? I have devised a method that uses the marginal utility of wealth plus a measure of inequality called the Gini coefficient to work out an estimate of the average utility, instead of the average income.

I then convert back into a dollar figure. This figure is the income everyone would need to have under perfect equality, in order to give the same real welfare as the current system. That is, if we could redistribute wealth in such a way to raise everyone above this value up to it, and lower everyone above this value down to it, the total welfare of the country would not change. This provides a well-founded ranking of which country’s people are actually better off overall, accounting for both overall income and the distribution of that income.

The estimate is sensitive to the precise form I use for marginal utility, so I’ll show you comparisons for three different cases.

The “conservative” estimate uses a risk aversion parameter of 1, which means that utility is logarithmic in income. The real value of a dollar is inversely proportional to the number of dollars you already have.

The medium estimate uses a risk aversion parameter of 2, which means that the real value of a dollar is inversely proportional to the square of the number of dollars you already have.

And then the “liberal” estimate uses a risk aversion parameter of 3, which means that the real value of a dollar is inversely proportional to the cube of the number of dollars you already have.

I’ll compare ten countries, which I think are broadly representative of classes of countries in the world today.

The United States, the world hegemon which needs no introduction.

China, rising world superpower and world’s most populous country.

India, world’s largest democracy and developing economy with a long way to go.

Norway, as representative of the Scandinavian social democracies.

Germany, as representative of continental Europe.

Russia, as representative of the Soviet Union and the Second World bloc.

Saudi Arabia, as representative of the Middle East petrostates.

Botswana, as representative of African developing economies.

Zimbabwe, as representative of failed Sub-Saharan African states.

Brazil, as representative of Latin American developing economies.
The ordering of these countries by GDP per-capita PPP is probably not too surprising:

  1. Norway 69,249
  2. United States 57,436
  3. Saudi Arabia 55,158
  4. Germany 48,111
  5. Russia 26,490
  6. Botswana 17,042
  7. China 15,399
  8. Brazil 15,242
  9. India 6,616
  10. Zimbabwe 1,970

Norway is clearly the richest, the US, Saudi Arabia, and Germany are quite close, Russia is toward the upper end, Botswana, China, and Brazil are close together in the middle, and then India and especially Zimbabwe are extremely poor.

But now let’s take a look at the inequality in each country, as measured by the Gini coefficient (which ranges from 0, perfect equality, to 1, total inequality).

  1. Botswana 0.605
  2. Zimbabwe 0.501
  3. Brazil 0.484
  4. United States 0.461
  5. Saudi Arabia 0.459
  6. China 0.422
  7. Russia 0.416
  8. India 0.351
  9. Germany 0.301
  10. Norway 0.259

The US remains (alarmingly) close to Saudi Arabia by this measure. Most of the countries are between 40 and 50. But Botswana is astonishingly unequal, while Germany and Norway are much more equal.

With that in mind, let’s take a look at the inequality-adjusted per-capita GDP. First, the conservative estimate, with a parameter of 1:

  1. Norway 58700
  2. United States 42246
  3. Saudi Arabia 40632
  4. Germany 39653
  5. Russia 20488
  6. China 11660
  7. Botswana 11138
  8. Brazil 11015
  9. India 5269
  10. Zimbabwe 1405

So far, ordering of nations is almost the same compared to what we got with just per-capita GDP. But notice how Germany has moved up closer to the US and Botswana actually fallen behind China.

Now let’s try a parameter of 2, which I think is the closest to the truth:

  1. Norway 49758
  2. Germany 32683
  3. United States 31073
  4. Saudi Arabia 29931
  5. Russia 15581
  6. China 8829
  7. Brazil 7961
  8. Botswana 7280
  9. India 4197
  10. Zimbabwe 1002

Now we have seen some movement. Norway remains solidly on top, but Germany has overtaken the United States and Botswana has fallen behind not only China, but also Brazil. Russia remains in the middle, and India and Zimbawbe remain on the bottom.

Finally, let’s try a parameter of 3.

  1. Norway 42179
  2. Germany 26937
  3. United States 22855
  4. Saudi Arabia 22049
  5. Russia 11849
  6. China 6685
  7. Brazil 5753
  8. Botswana 4758
  9. India 3343
  10. Zimbabwe 715

Norway has now pulled far and away ahead of everyone else. Germany is substantially above the United States. China has pulled away from Brazil, and Botswana has fallen almost all the way to the level of India. Zimbabwe, as always, is at the very bottom.

Let’s compare this to another measure of national well-being, the Inequality-Adjusted Human Development Index (which goes from 0, the worst, to 1 the best). This index combines education, public health, and income, and adjusts for inequality. It seems to be a fairly good measure of well-being, but it’s very difficult to compile data for, so a lot of countries are missing (including Saudi Arabia); plus the precise weightings on everything are very ad hoc.

  1. Norway 0.898
  2. Germany 0.859
  3. United States 0.796
  4. Russia 0.725
  5. China 0.543
  6. Brazil 0.531
  7. India 0.435
  8. Botswana 0.433
  9. Zimbabwe 0.371

Other than putting India above Botswana, this ordering is the same as what we get from my (much easier to calculate and theoretically more well-founded) index with either a parameter of 2 or 3.

What’s more, my index can be directly interpreted: The average standard of living in the US is as if everyone were making $31,073 per year. What exactly is an IHDI index of 0.796 supposed to mean? We’re… 79.6% of the way to the best possible country?

In any case, there’s a straightforward (if not terribly surprising) policy implication here: Inequality is a big problem.

In particular, inequality in the US is clearly too high. Despite an overall income that is very high, almost 18 log points higher than Germany, our overall standard of living is actually about 5 log points lower due to our higher level of inequality. While our average income is only 19 log points lower than Norway, our actual standard of living is 47 log points lower.

Inequality in Botswana also means that their recent astonishing economic growth is not quite as impressive as it at first appeared. Many people are being left behind. While in raw income they appear to be 10 log points ahead of China and only 121 log points behind the US, once you adjust for their very high inequality they are 19 log points behind China, and 145 log points behind the US.

Of course, some things don’t change. Norway is still on top, and Zimbabwe is still on the bottom.

Student debt crisis? What student debt crisis?

Dec 18, JDN 2457741
As of this writing, I have over $99,000 in student loans. This is a good thing. It means that I was able to pay for my four years of college, and two years of a master’s program, in order to be able to start this coming five years of a PhD. When I have concluded these eleven years of postgraduate education and incurred six times the world per-capita income in debt, what then will become of me? Will I be left to live on the streets, destitute and overwhelmed by debt?

No. I’ll have a PhD. The average lifetime income of individuals with PhDs in the United States is $3.4 million. Indeed, the median annual income for economists in the US is almost exactly what I currently owe in debt—so if I save well, I could very well pay it off in just a few years. With an advanced degree in economics like mine, or similarly high-paying fields such as physics, medicine, and law one can expect the higher end of that scale, $4 million or more; with a degree in a less-lucrative field such as art, literature, history, or philosophy, one would have to settle for “only” say $3 million. The average lifetime income in the US for someone without any college education is only $1.2 million. So even in literature or history, a PhD is worth about $2 million in future income.

On average, an additional year of college results in a gain in lifetime future earnings of about 15% to 20%. Even when you adjust for interest rates and temporal discounting, this is a rate of return that would make any stock trader envious.

Fitting the law of diminishing returns, the rates of return on education in poor countries are even larger, often mind-bogglingly huge; the increase in lifetime income from a year of college education in Botswana was estimated at 38%. This implies that someone who graduates from college in Botswana earns four times as much money as someone who only finished high school.

We who pay $100,000 to receive an additional $2 to $3 million can hardly be called unfortunate.

Indeed, we are mind-bogglingly fortunate; we have been given an opportunity to better ourselves and the society we live in that is all but unprecedented in human history granted only to a privileged few even today. Right now, only about half of adults in the most educated countries in the world (Canada, Russia, Israel, Japan, Luxembourg, South Korea, and the United States) ever go to college. Only 30% of Americans ever earn a bachelor’s degree, and as recently as 1975 that figure was only 20%. Worldwide, the majority of people never graduate from high school. The average length of schooling in developing countries today is six yearsthat is, sixth grade—and this is an enormous improvement from the two years of average schooling found in developing countries in 1950.

If we look a bit further back in history, the improvements in education are even more staggering. In the United States in 1910, only 13.5% of people graduated high school, and only 2.7% completed a bachelor’s degree. There was no student debt crisis then, to be sure—because there were no college students.

Indeed, I have been underestimating the benefits of education thus far, because education is both a public and private good. The figures I’ve just given have been only the private financial return on education—the additional income received by an individual because they went to college. But there is also a non-financial return, such as the benefits of working in a more appealing or exciting career and the benefits of learning for its own sake. The reason so many people do go into history and literature instead of economics and physics very likely has to do with valuing these other aspects of education as highly as or even more highly than financial income, and it is entirely rational for people to do so. (An interesting survey question I’ve alas never seen asked: “How much money would we have to give you right now to convince you to quit working in philosophy for the rest of your life?”)

Yet even more important is the public return on education, the increased productivity and prosperity of our society as a result of greater education—and these returns are enormous. For every $1 spent on education in the US, the economy grows by an estimated $1.50. Public returns on college education worldwide are on the order of 10%-20% per year of education. This is over and above the 15-20% return already being made by the individuals going to school. This means that raising the average level of education in a country by just one year raises that country’s income by between 25% and 40%.

Indeed, perhaps the simplest way to understand the enormous social benefits of education is to note the strong correlation between education level and income level. This graph comes from the UN Human Development Report Data Explorer; it plots the HDI education index (which ranges from 0, least educated, to 1, most educated) and the per-capita GDP at purchasing power parity (on a log scale, so that each increment corresponds to a proportional increase in GDP); as you can see, educated countries tend to be rich countries, and vice-versa.

hdi_education_income_labeled

Of course, income drives education just as education drives income. But more detailed econometric studies generally (though not without some controversy) show the same basic result: The more educated a country’s people become, the richer that country becomes.

And indeed, the United States is a spectacularly rich country. The figure of “$1 trillion in college debt” sounds alarming (and has been used to such effect in many a news article, ranging from the New York Daily News, Slate, and POLITICO to USA Today and CNN all the way to Bloomberg, MarketWatch, and Business Insider, and even getting support from the Consumer Financial Protection Bureau and The Federal Reserve Bank of New York).

But the United States has a total GDP of over $18.6 trillion, and total net wealth somewhere around $84 trillion. Is it really so alarming that our nation’s most important investment would result in debt of less than two percent of our total nation’s wealth? Democracy Now asks who is getting rich off of $1.3 trillion in student debt? All of us—the students especially.

In fact, the probability of defaulting on student loans is inversely proportional to the amount of loans a student has. Students with over $100,000 in student debt default only 18% of the time, while students with less than $5,000 in student debt default 34% of the time. This should be shocking to those who think that we have a crisis of too much student debt; if student debt were an excess burden that is imposed upon us for little gain, default rates should rise as borrowing amounts increase, as we observe, for example, with credit cards: there is a positive correlation between carrying higher balances and being more likely to default. (This also raises doubts about the argument that higher debt loads should carry higher interest rates—why, if the default rate doesn’t go up?) But it makes perfect sense if you realize that college is an investment—indeed, almost certainly both the most profitable and the most socially responsible investment most people will ever have the opportunity to make. More debt means you had access to more credit to make a larger investment—and therefore your payoff was greater and you were more likely to be able to repay the debt.

Yes, job prospects were bad for college graduates right after the Great Recession—because it was right after the Great Recession, and job prospects were bad for everyone. Indeed, the unemployment rate for people with college degrees was substantially lower than for those without college degrees, all the way through the Second Depression. The New York Times has a nice little gadget where you can estimate the unemployment rate for college graduates; my hint for you is that I just said it’s lower, and I still guessed too high. There was variation across fields, of course; unsurprisingly computer science majors did extremely well and humanities majors did rather poorly. Underemployment was a big problem, but again, clearly because of the recession, not because going to college was a mistake. In fact, unemployment for college graduates (about 9%) has always been so much lower than unemployment for high school dropouts that the maximum unemployment rate for young college graduates is less than the minimum unemployment rate for young high school graduates (10%) over the entire period since the year 2000. Young high school dropouts have fared even worse; their minimum unemployment rate since 2000 was 18%, while their maximum was a terrifying Great Depression-level of 32%. Education isn’t just a good investment—it’s an astonishingly good investment.

There are a lot of things worth panicking about, now that Trump has been elected President. But student debt isn’t one of them. This is a very smart investment, made with a reasonable portion of our nation’s wealth. If you have student debt like I do, make sure you have enough—or otherwise you might not be able to pay it back.

Meanwhile, we’ve been ending world hunger.

JDN 2457303 EDT 19:56

As reported in The Washington Post and Fortune, the World Bank recently released a report showing that for the first time on record—possibly the first time in human history—global extreme poverty has fallen below 10% of the population. Based on a standard of living of $1.90 per day at 2011 purchasing power parity—that’s about $700 per year, a bit less than the average income in Malawi.

The UN World Millennium Development Goal set in 1990 was to cut extreme poverty in half by 2015; in fact we have cut it by more than two-thirds, reducing it from 37% of the world’s population in 1990 to 9.6% today. This is an estimate, based upon models of what’s going on in countries where we don’t have reliable data; ever the cautious scientists, the World Bank prefers to focus on the most recent fully reliable data, which says that we reduced extreme poverty to 12.7% in 2012 and therefore achieved the Millennium Development Goal.

Most of this effect comes from one very big country: China. Over 750 million people in China saw their standard of living rise above the extreme poverty level in the last 30 years.
The slowest reduction in poverty has been in Africa, specifically Sub-Saharan Africa, where extreme poverty has barely budged, from 53% in 1981 to 47% in 2011. But some particular countries in Africa have done better; thanks to good governance—including better free speech protection than the United States, shame on us—Botswana has reduced their extreme poverty rate from over 50% in 1965 to 19% today.

A lot of World Bank officials have been focusing on the fact that there is still much to be done; 10% in extreme poverty is still 10% too many, and even once everyone is above $1.90 per day that still leaves a lot of people at $3 per day and $4 per day which is still pretty darn poor. The project of global development won’t really seem complete until everyone in the world lives above not just the global poverty line, but something more like a First World poverty line, with a home to live in, a doctor to see, a school to attend, clean water, flush toilets, electricity, and probably even a smartphone with Internet access. (If the latter seems extravagant, let me remind you that more people in the world have smartphones than have flush toilets, because #weliveinthefuture.)

Pace the Heritage Foundation, the fact that what we call poverty in America typically includes having a refrigerator, a microwave, and a car doesn’t mean it isn’t actually poverty; it simply means that poverty in the First World isn’t nearly as bad as poverty in the Third World. (After all, over 9% of children in the US live in households with low food security, and 1% live in households with very low food security; hunger in America isn’t as bad as hunger in Malawi, but it’s still hunger.) Maybe it even means we should focus on the Third World, though that argument isn’t as strong as it might appear; to eliminate poverty in the US, all we’d need to do is pass a law that implements a basic income. To eliminate poverty worldwide, we’d need a global project of economic and political reforms to change how hundreds of countries are governed.

Yet, this focus on what we haven’t accomplished (as though we were going to cut funding to the UN Development Program because we’re done now or something) is not only disheartening, it’s unreasonable. We have accomplished something truly spectacular.

We are now on the verge of solving on one of the great problems of human existence, a problem so deep, so ancient, and so fundamental that it’s practically a cliche: We say “end world hunger” in the same breath as “cure cancer” (which doesn’t even make sense) or “conquer death” (which is not as far off as you may think). Yet, in a very real sense, we are on the verge of ending world hunger.

While most people have been focused on other things, from a narcissistic billionaire running for President to the uniquely American tragedy of mass shootings, development economists have been focused on one thing: Conquering global poverty. What this report means is that now, at last, victory is within our grasp.

Development economists are unsung heroes; without their research, their field work, and their advice and pressure to policymakers, we would never have gotten this far. It was development economists who made the UN Millennium Development Goals, and development economists who began to achieve them.

Yet perhaps there is an even more unsung hero in all of this: Capitalism.

I often have a lot of criticisms of capitalism, at least as it operates in the real world; yet it was in the real world that extreme poverty was just brought down below 10%, and it was done primarily by capitalism. I know a lot of people who think that we need to tear down this whole system and replace it with something fundamentally different, but the kind of progress we are making in global development tells me that we need nothing of the sort. We do need to make changes in policy, but they are small changes, simple changes—many of them could be made with the passing of a few simple laws. Capitalism is not fundamentally broken; on the contrary, it is the fundamentals of capitalism that have brought humanity for the first time within arm’s reach of ending world hunger. We need to fix the system at the edges, not throw it away.

Recall that I said most of the poverty reduction occurred in China. What has China been doing lately? They’ve been opening to world trade—that “free trade” stuff I talked about before. They’ve been cutting tariffs. They’ve been privatizing industries. They’ve been letting unprofitable businesses fail so that new ones can rise in their place. They have, in short, been making themselves more capitalist. Building schools, factories, and yes, even sweatshops is what has made China’s rise out of poverty possible. They are still doing many things wrong—not least their authoritarian government, which is now gamifying oppression in truly cyberpunk fashion—but they are doing a few very important things right.

World hunger is on the way out. And I can think of no better reason to celebrate.

What makes a nation wealthy?

JDN 2457251 EDT 10:17

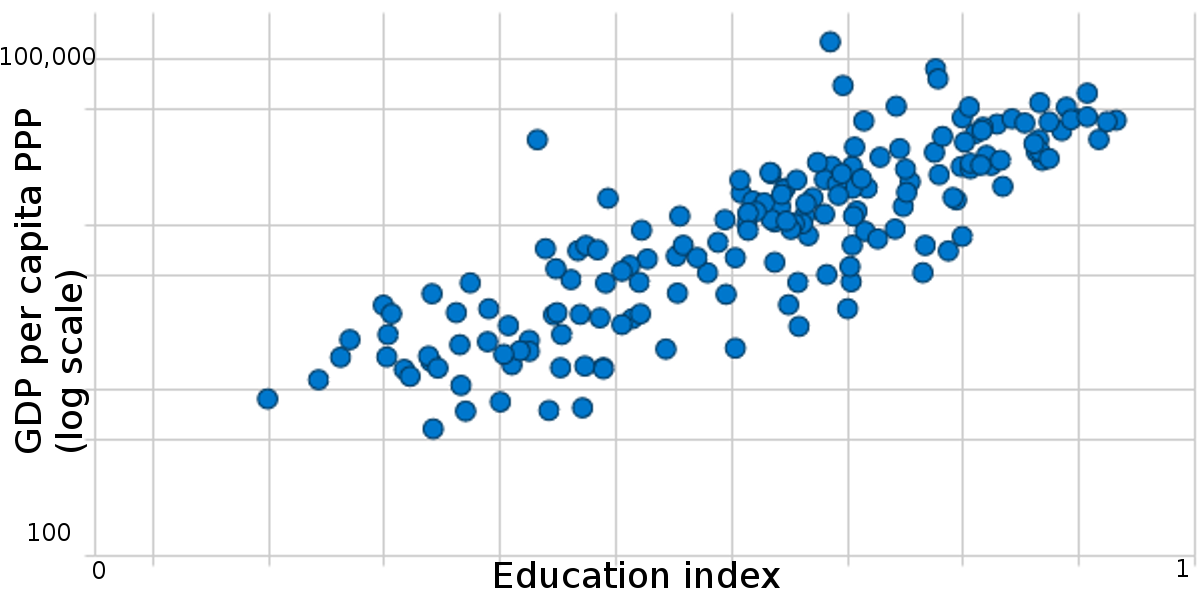
One of the central questions of economics—perhaps the central question, the primary reason why economics is necessary and worthwhile—is development: How do we raise a nation from poverty to prosperity?

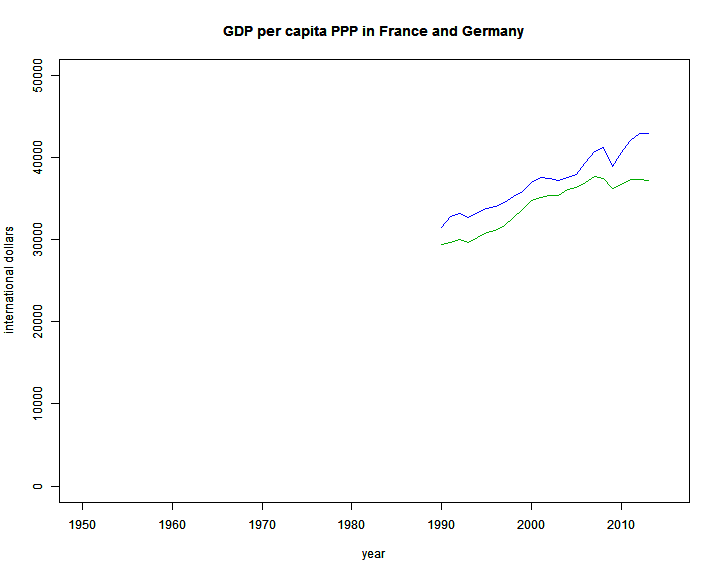
We have done it before: France and Germany rose from the quite literal ashes of World War 2 to some of the most prosperous societies in the world. Their per-capita GDP over the 20th century rose like this (all of these figures are from the World Bank World Development Indicators; France is green, Germany is blue):

GDPPC_France_Germany

GDPPCPPP_France_Germany

The top graph is at market exchange rates, the bottom is correcting for purchasing power parity (PPP). The PPP figures are more meaningful, but unfortunately they only began collecting good data on purchasing power around 1990.

Around the same time, but even more spectacularly, Japan and South Korea rose from poverty-stricken Third World backwaters to high-tech First World powers in only a couple of generations. Check out their per-capita GDP over the 20th century (Japan is green, South Korea is blue):

GDPPC_Japan_KoreaGDPPCPPP_Japan_Korea


This is why I am only half-joking when I define development economics as “the ongoing project to figure out what happened in South Korea and make it happen everywhere in the world”.

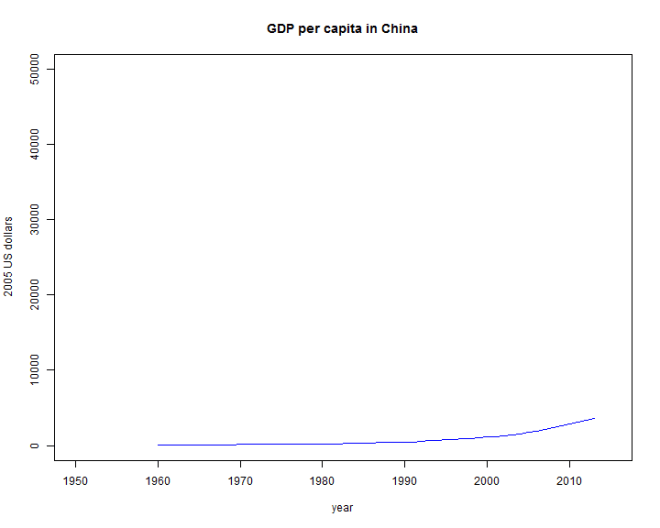
More recently China has been on a similar upward trajectory, which is particularly important since China comprises such a huge portion of the world’s population—but they are far from finished:

GDPPC_ChinaGDPPCPPP_China

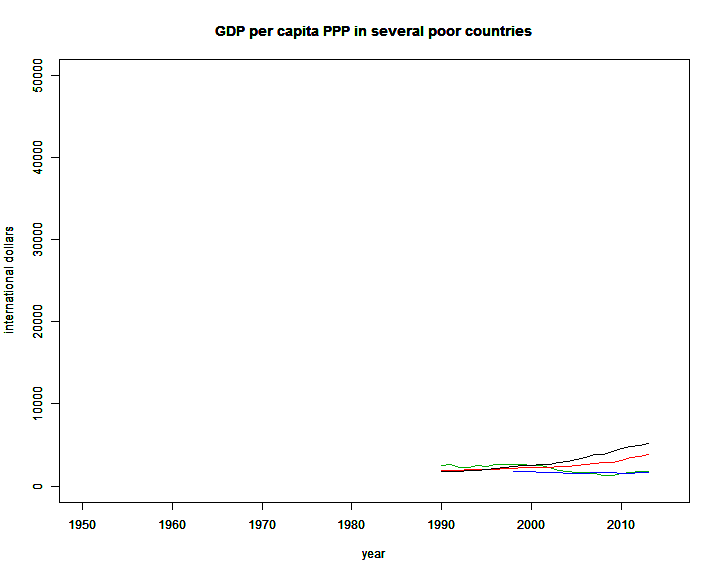
Compare these to societies that have not achieved economic development, such as Zimbabwe (green), India (black), Ghana (red), and Haiti (blue):

GDPPC_poor_countriesGDPPCPPP_poor_countries

They’re so poor that you can barely see them on the same scale, so I’ve rescaled so that the top is $5,000 per person per year instead of $50,000:

GDPPC_poor_countries_rescaledGDPPCPPP_poor_countries_rescaled

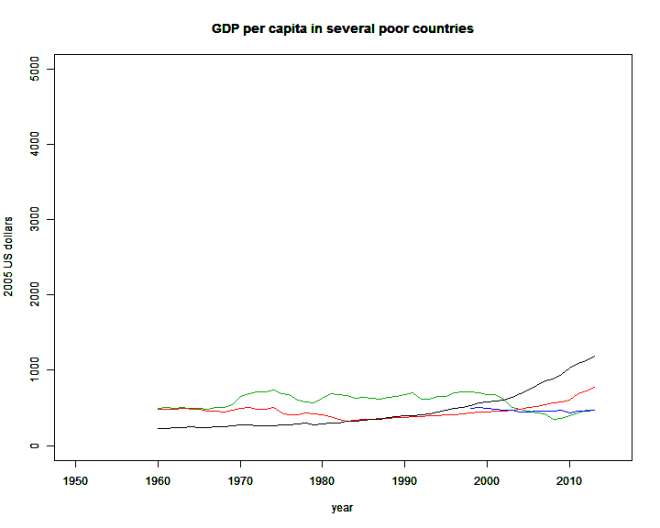
Only India actually manages to get above $5,000 per person per year at purchasing power parity, and then not by much, reaching $5,243 per person per year in 2013, the most recent data.

I had wanted to compare North Korea and South Korea, because the two countries were united as recently as the 1945 and were not all that different to begin with, yet have taken completely different development trajectories. Unfortunately, North Korea is so impoverished, corrupt, and authoritarian that the World Bank doesn’t even report data on their per-capita GDP. Perhaps that is contrast enough?

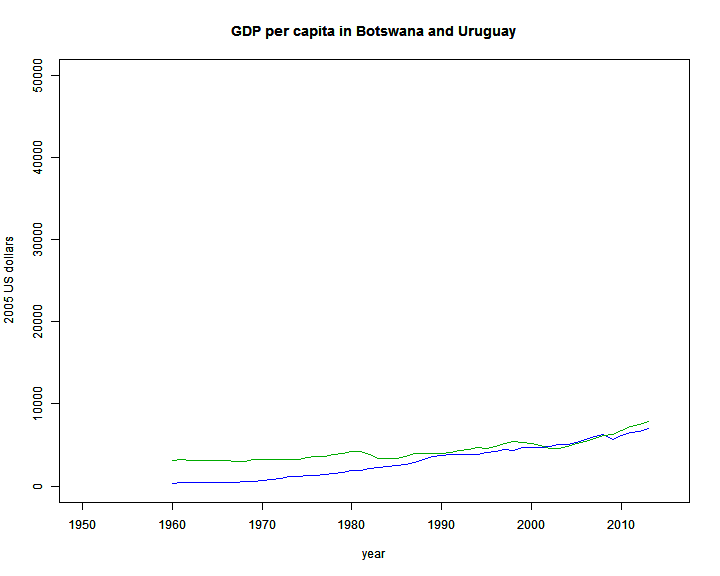
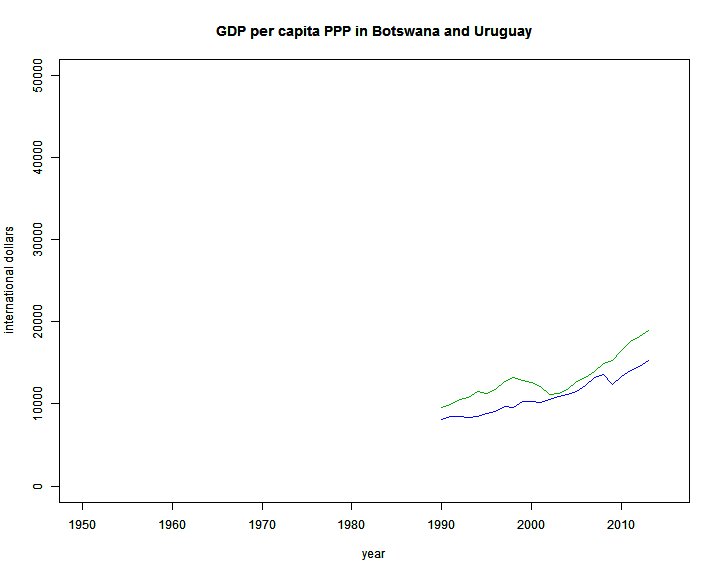
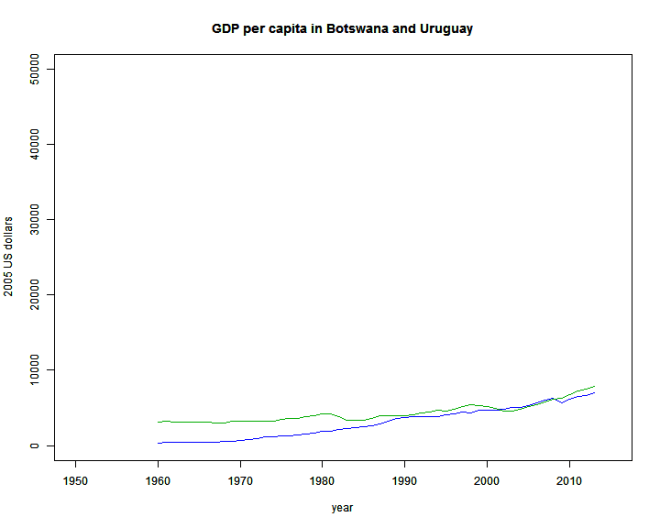
And then of course there are the countries in between, which have made some gains but still have a long way to go, such as Uruguay (green) and Botswana (blue):

GDPPC_Botswana_UruguayGDPPCPPP_Botswana_Uruguay

But despite the fact that we have observed successful economic development, we still don’t really understand how it works. A number of theories have been proposed, involving a wide range of factors including exports, corruption, disease, institutions of government, liberalized financial markets, and natural resources (counter-intuitively; more natural resources make your development worse).

I’m not going to resolve that whole debate in a single blog post. (I may not be able to resolve that whole debate in a single career, though I am definitely trying.) We may ultimately find that economic development is best conceived as like “health”; what factors determine your health? Well, a lot of things, and if any one thing goes badly enough wrong the whole system can break down. Economists may need to start thinking of ourselves as akin to doctors (or as Keynes famously said, dentists), diagnosing particular disorders in particular patients rather than seeking one unifying theory. On the other hand, doctors depend upon biologists, and it’s not clear that we yet understand development even at that level.

Instead I want to take a step back, and ask a more fundamental question: What do we mean by prosperity?

My hope is that if we can better understand what it is we are trying to achieve, we can also better understand the steps we need to take in order to get there.

Thus far it has sort of been “I know it when I see it”; we take it as more or less given that the United States and the United Kingdom are prosperous while Ghana and Haiti are not. I certainly don’t disagree with that particular conclusion; I’m just asking what we’re basing it on, so that we can hopefully better apply it to more marginal cases.


For example: Is
France more or less prosperous than Saudi Arabia? If we go solely by GDP per capita PPP, clearly Saudi Arabia is more prosperous at $53,100 per person per year than France is at $37,200 per person per year.

But people actually live longer in France, on average, than they do in Saudi Arabia. Overall reported happiness is higher in France than Saudi Arabia. I think France is actually more prosperous.


In fact, I think the United States is not as prosperous as we pretend ourselves to be. We are certainly more prosperous than most other countries; we are definitely still well within First World status. But we are not the most prosperous nation in the world.

Our total GDP is astonishingly high (highest in the world nominally, second only to China PPP). Our GDP per-capita is higher than any other country of comparable size; no nation with higher GDP PPP than the US has a population larger than the Chicago metropolitan area. (You may be surprised to find that in order from largest to smallest population the countries with higher GDP per capita PPP are the United Arab Emirates, Switzerland, Hong Kong, Singapore, and then Norway, followed by Kuwait, Qatar, Luxembourg, Brunei, and finally San Marino—which is smaller than Ann Arbor.) Our per-capita GDP PPP of $51,300 is markedly higher than that of France ($37,200), Germany ($42,900), or Sweden ($43,500).

But at the same time, if you compare the US to other First World countries, we have nearly the highest rate of child poverty and higher infant mortality. We have shorter life expectancy and dramatically higher homicide rates. Our inequality is the highest in the world. In France and Sweden, the top 0.01% receive about 1% of the income (i.e. 100 times as much as the average person), while in the United States they receive almost 4%, making someone in the top 0.01% nearly 400 times as rich as the average person.

By estimating solely on GDP per capita, we are effectively rigging the game in our own favor. Or rather, the rich in the United States are rigging the game in their own favor (what else is new?), by convincing all the world’s economists to rank countries based on a measure that favors them.

Amartya Sen, one of the greats of development economics, developed a scale called the Human Development Index that attempts to take broader factors into account. It’s far from perfect, but it’s definitely a step in the right direction.

In particular, France’s HDI is higher than that of Saudi Arabia, fitting my intuition about which country is truly more prosperous. However, the US still does extremely well, with only Norway, Australia, Switzerland, and the Netherlands above us. I think we might still be biased toward high average incomes rather than overall happiness.

In practice, we still use GDP an awful lot, probably because it’s much easier to measure. It’s sort of like IQ tests and SAT scores; we know damn well it’s not measuring what we really care about, but because it’s so much easier to work with we keep using it anyway.

This is a problem, because the better you get at optimizing toward the wrong goal, the worse your overall outcomes are going to be. If you are just sort of vaguely pointed at several reasonable goals, you will probably be improving your situation overall. But when you start precisely optimizing to a specific wrong goal, it can drag you wildly off course.

This is what we mean when we talk about “gaming the system”. Consider test scores, for example. If you do things that will probably increase your test scores among other things, you are likely to engage in generally good behaviors like getting enough sleep, going to class, studying the content. But if your single goal is to maximize your test score at all costs, what will you do? Cheat, of course.

This is also related to the Friendly AI Problem: It is vitally important to know precisely what goals we want our artificial intelligences to have, because whatever goals we set, they will probably be very good at achieving them. Already computers can do many things that were previously impossible, and as they improve over time we will reach the point where in a meaningful sense our AIs are even smarter than we are. When that day comes, we will want to make very, very sure that we have designed them to want the same things that we do—because if our desires ever come into conflict, theirs are likely to win. The really scary part is that right now most of our AI research is done by for-profit corporations or the military, and “maximize my profit” and “kill that target” are most definitely not the ultimate goals we want in a superintelligent AI. It’s trivially easy to see what’s wrong with these goals: For the former, hack into the world banking system and transfer trillions of dollars to the company accounts. For the latter, hack into the nuclear launch system and launch a few ICBMs in the general vicinity of the target. Yet these are the goals we’ve been programming into the actual AIs we build!

If we set GDP per capita as our ultimate goal to the exclusion of all other goals, there are all sorts of bad policies we would implement: We’d ignore inequality until it reached staggering heights, ignore work stress even as it began to kill us, constantly try to maximize the pressure for everyone to work constantly, use poverty as a stick to force people to work even if people starve, inundate everyone with ads to get them to spend as much as possible, repeal regulations that protect the environment, workers, and public health… wait. This isn’t actually hypothetical, is it? We are doing those things.

At least we’re not trying to maximize nominal GDP, or we’d have long-since ended up like Zimbabwe. No, our economists are at least smart enough to adjust for purchasing power. But they’re still designing an economic system that works us all to death to maximize the number of gadgets that come off assembly lines. The purchasing-power adjustment doesn’t include the value of our health or free time.

This is why the Human Development Index is a major step in the right direction; it reminds us that society has other goals besides maximizing the total amount of money that changes hands (because that’s actually all that GDP is measuring; if you get something for free, it isn’t counted in GDP). More recent refinements include things like “natural resource services” that include environmental degradation in estimates of investment. Unfortunately there is no accepted way of doing this, and surprisingly little research on how to improve our accounting methods. Many nations seem resistant to doing so precisely because they know it would make their economic policy look bad—this is almost certainly why China canceled its “green GDP” initiative. This is in fact all the more reason to do it; if it shows that our policy is bad, that means our policy is bad and should be fixed. But people have allowed themselves to value image over substance.

We can do better still, and in fact I think something like QALY is probably the way to go. Rather than some weird arbitrary scaling of GDP with lifespan and Gini index (which is what the HDI is), we need to put everything in the same units, and those units must be directly linked to human happiness. At the very least, we should make some sort of adjustment to our GDP calculation that includes the distribution of wealth and its marginal utility; adding $1,000 to the economy and handing it to someone in poverty should count for a great deal, but adding $1,000,000 and handing it to a billionaire should count for basically nothing. (It’s not bad to give a billionaire another million; but it’s hardly good either, as no one’s real standard of living will change.) Calculating that could be as simple as dividing by their current income; if your annual income is $10,000 and you receive $1,000, you’ve added about 0.1 QALY. If your annual income is $1 billion and you receive $1 million, you’ve added only 0.001 QALY. Maybe we should simply separate out all individual (or household, to be simpler?) incomes, take their logarithms, and then use that sum as our “utility-adjusted GDP”. The results would no doubt be quite different.

This would create a strong pressure for policy to be directed at reducing inequality even at the expense of some economic output—which is exactly what we should be willing to do. If it’s really true that a redistribution policy would hurt the overall economy so much that the harms would outweigh the benefits, then we shouldn’t do that policy; but that is what you need to show. Reducing total GDP is not a sufficient reason to reject a redistribution policy, because it’s quite possible—easy, in fact—to improve the overall prosperity of a society while still reducing its GDP. There are in fact redistribution policies so disastrous they make things worse: The Soviet Union had them. But a 90% tax on million-dollar incomes would not be such a policy—because we had that in 1960 with little or no ill effect.

Of course, even this has problems; one way to minimize poverty would be to exclude, relocate, or even murder all your poor people. (The Black Death increased per-capita GDP.) Open immigration generally increases poverty rates in the short term, because most of the immigrants are poor. Somehow we’d need to correct for that, only raising the score if you actually improve people’s lives, and not if you make them excluded from the calculation.

In any case it’s not enough to have the alternative measures; we must actually use them. We must get policymakers to stop talking about “economic growth” and start talking about “human development”; a policy that raises GDP but reduces lifespan should be immediately rejected, as should one that further enriches a few at the expense of many others. We must shift the discussion away from “creating jobs”—jobs are only a means—to “creating prosperity”.