Extrapolating the INE

Apr 6 JDN 2460772

I was only able to find sufficient data to calculate the Index of Necessary Expenditure back to 1990. But I found a fairly consistent pattern that the INE grew at a rate about 20% faster than the CPI over that period, so I decided to take a look at what longer-term income growth looks like if we extrapolate that pattern back further in time.

The result is this graph:

Using the CPI, real per-capita GDP in the US (in 2024 dollars) has grown from $25,760 in 1950 to $85,779 today—increasing by a factor of 3.33. Even accounting for increased inequality and the fact that more families have two income earners, that’s still a substantial increase.

But using the extrapolated INE, real per-capita GDP has only grown from $43,622 in 1950 to $85,779 today—increasing by only a factor of 1.97. This is a much smaller increase, especially when we adjusted for increased inequality and increased employment for women.

Even without the extrapolation, it’s still clear that real INE-adjusted incomes have were basically stagnant in the 2000s, increased rather slowly in the 2020s, and then actually dropped in 2022 after a bunch of government assistance ended. What looked, under the CPI, like steadily increasing real income was actually more like treading water.

Should we trust this extrapolation? It’s a pretty simplistic approach, I admit. But I think it is plausible when we consider this graph of the ratio between median income and median housing price:

This ratio was around 6 in the 1950s, then began to fall until in the 1970s it stabilized around 4. It began to slowly creep back up, but then absolutely skyrocketed in the 2000s before the 2008 crash. Now it has been rising again, and is now above 7, the highest it has been since the Second World War. (Does this mean we’re due for another crash? I’d bet as much.)

What does this mean? It means that a typical family used to be able to afford a typical house with only four years of their total income—and now would require seven. In that sense, homes are now 75% more expensive today than they were in the 1970s.

Similar arguments can be made for the rising costs of education and healthcare; while many prices have not grown much (gasoline) or even fallen (jewelry and technology), these necessities have continued to grow more and more expensive, not simply in nominal terms, but even compared to the median income.

This is further evidence that our standard measures of “inflation” and “real income” are fundamentally inadequate. They simply aren’t accurately reflecting the real cost of living for most American families. Even in many times when it seemed “inflation” was low and “real income” was growing, in fact it was growing harder and harder to afford vital necessities such as housing, education, and healthcare.

This economic malaise may have been what contributed to the widespread low opinion of Biden’s economy. While the official figures looked good, people’s lives weren’t actually getting better.

Yet this is still no excuse for those who voted for Trump; even the policies he proudly announced he would do—like tariffs and deportations—have clearly made these problems worse, and this was not only foreseeable but actually foreseen by the vast majority of the world’s economists. Then there are all the things he didn’t even say he would do but is now doing, like cozying up to Putin, alienating our closest allies, and discussing “methods” for achieving an unconstitutional third term.

Indeed, it honestly feels quite futile to even reflect upon what was wrong with our economy even when things seemed to be running smoothly, because now things are rapidly getting worse, and showing no sign of getting better in any way any time soon.

Reflections on the Index of Necessary Expenditure

Mar 16 JDN 2460751

In last week’s post I constructed an Index of National Expenditure (INE), attempting to estimate the total cost of all of the things a family needs and can’t do without, like housing, food, clothing, cars, healthcare, and education. What I found shocked me: The median family cannot afford all necessary expenditures.

I have a couple more thoughts about that.

I still don’t understand why people care so much about gas prices.

Gasoline was a relatively small contribution to INE. It was more than clothing but less than utilities, and absolutely dwarfed by housing, food, or college. I thought maybe since I only counted a 15-mile commute, maybe I didn’t actually include enoughgasoline usage, but based on this estimate of about $2000 per driver, I was in about the right range; my estimate for the same year was $3350 for a 2-car family.

I think I still have to go with my salience hypothesis: Gasoline is the only price that we plaster in real-time on signs on the side of the road. So people are constantly aware of it, even though it isn’t actually that important.

The price surge that should be upsetting people is housing.

If the price of homes had only risen with the rate of CPI inflation instead of what it actually did, the median home price in 2024 would be only $234,000 instead of the $396,000 it actually is; and by my estimation that would save a typical family $11,000 per year—a whopping 15% of their income, and nearly enough to make the INE affordable by itself.

Now, I’ll consider some possible objections to my findings.

Objection 1: A typical family doesn’t actually spend this much on these things.

You’re right, they don’t! Because they couldn’t possibly. Even with substantial debt, you just can’t sustainably spend 125% of your after-tax household income.

My goal here was not to estimate how much families actually spend; it was to estimate how much they need to spend in order to live a good life and not feel deprived.


What I have found is that most American families feel deprived. They are forced to sacrifice something really important—like healthcare, or education, or owning a home—because they simply can’t afford it.

What I’m trying to do here is find the price of the American Dream; and what I’ve found is that the American Dream has a price that most Americans cannot afford.

Objection 2: You should use median healthcare spending, not mean.

I did in fact use mean figures instead of median for healthcare expenditures, mainly because only the mean was readily available. Mean income is higher than median income, so you might say that I’ve overestimated healthcare expenditure—and in a sense that’s definitely true. The median family spends less than this on healthcare.

But the reason that the median family spends less than this on healthcare is not that they want to, but that they have to. Healthcare isn’t a luxury that people buy more of because they are richer. People buy either as much as they need or as much as they can afford—whichever is lower, which is typically the latter. Using the mean instead of the median is a crude way to account for that, but I think it’s a defensible one.

But okay, let’s go ahead and cut the estimate of healthcare spending in half; even if you do that, the INE is still larger than after-tax median household income in most years.

Objection 3: A typical family isn’t a family of four, it’s a family of three.

Yes, the mean number of people in a family household in the US is 3.22 (the median is 3).

This is a very bad thing.

Part of what I seem to be finding here is that a family of four is unaffordable—literally impossible to afford—on a typical family income.

But a healthy society is one in which typical families have two or three children. That is what we need in order to achieve population replacement. When families get smaller than that, we aren’t having enough children, and our population will decline—which means that we’ll have too many old people relative to young people. This puts enormous pressure on healthcare and pension systems, which rely upon the fact that young people produce more, in order to pay for the fact that old people cost more.

The ideal average number of births per woman is about 2.1; this is what would give us a steady population. No US state has fertility above this level. The only reason the US population is growing rather than shrinking is that we are taking in immigrants.

This is bad. This is not sustainable. If the reason families aren’t having enough kids is that they can’t afford them—and this fits with other research on the subject—then this economic failure damages our entire society, and it needs to be fixed.

Objection 4: Many families buy their cars used.

Perhaps 1/10 of a new car every year isn’t an ideal estimate of how much people spend on their cars, but if anything I think it’s conservative, because if you only buy a car every 10 years, and it was already used when you bought it, you’re going to need to spend a lot on maintaining it—quite possibly more than it would cost to get a new one. Motley Fool actually estimates the ownership cost of just one car at substantially more than I estimated for two cars. So if anything your complaint should be that I’ve underestimated the cost by not adequately including maintenance and insurance.

Objection 5: Not everyone gets a four-year college degree.

Fair enough; a substantial proportion get associate’s degrees, and most people get no college degree at all. But some also get graduate degrees, which is even more expensive (ask me how I know).

Moreover, in today’s labor market, having a college degree makes a huge difference in your future earnings; a bachelor’s degree increases your lifetime earnings by a whopping 84%. In theory it’s okay to have a society where most people don’t go to college; in practice, in our society, not going to college puts you at a tremendous disadvantage for the rest of your life. So we either need to find a way to bring wages up for those who don’t go to college, or find a way to bring the cost of college down.

This is probably one of the things that families actually choose to scrimp on, only sending one kid to college or none at all. But because college is such a huge determinant of earnings, this perpetuates intergenerational inequality: Only rich families can afford to send their kids to college, and only kids who went to college grow up to have rich families.

Objection 6: You don’t actually need to save for college; you can use student loans.

Yes, you can, and in practice, most people who to college do. But while this solves the liquidity problem (having enough money right now), it does not solve the solvency problem (having enough money in the long run). Failing to save for college and relying on student loans just means pushing the cost of college onto your children—and since we’ve been doing that for over a generation, feel free to replace the category “college savings” with “repaying student loans”; it won’t meaningfully change the results.

The Index of Necessary Expenditure

Mar 16 JDN 2460751

I’m still reeling from the fact that Donald Trump was re-elected President. He seemed obviously horrible at the time, and he still seems horrible now, for many of the same reasons as before (we all knew the tariffs were coming, and I think deep down we knew he would sell out Ukraine because he loves Putin), as well as some brand new ones (I did not predict DOGE would gain access to all the government payment systems, nor that Trump would want to start a “crypto fund”). Kamala Harris was not an ideal candidate, but she was a good candidate, and the comparison between the two could not have been starker.

Now that the dust has cleared and we have good data on voting patterns, I am now less convinced than I was that racism and sexism were decisive against Harris. I think they probably hurt her some, but given that she actually lost the most ground among men of color, racism seems like it really couldn’t have been a big factor. Sexism seems more likely to be a significant factor, but the fact that Harris greatly underperformed Hillary Clinton among Latina women at least complicates that view.

A lot of voters insisted that they voted on “inflation” or “the economy”. Setting aside for a moment how absurd it was—even at the time—to think that Trump (he of the tariffs and mass deportations!) was going to do anything beneficial for the economy, I would like to better understand how people could be so insistent that the economy was bad even though standard statistical measures said it was doing fine.

Krugman believes it was a “vibecession”, where people thought the economy was bad even though it wasn’t. I think there may be some truth to this.


But today I’d like to evaluate another possibility, that what people were really reacting against was not inflation per se but necessitization.

I first wrote about necessitization in 2020; as far as I know, the term is my own coinage. The basic notion is that while prices overall may not have risen all that much, prices of necessities have risen much faster, and the result is that people feel squeezed by the economy even as CPI growth remains low.

In this post I’d like to more directly evaluate that notion, by constructing an index of necessary expenditure (INE).

The core idea here is this:

What would you continue to buy, in roughly the same amounts, even if it doubled in price, because you simply can’t do without it?

For example, this is clearly true of housing: You can rent or you can own, but can’t not have a house. And nor are most families going to buy multiple houses—and they can’t buy partial houses.

It’s also true of healthcare: You need whatever healthcare you need. Yes, depending on your conditions, you maybe could go without, but not without suffering, potentially greatly. Nor are you going to go out and buy a bunch of extra healthcare just because it’s cheap. You need what you need.

I think it’s largely true of education as well: You want your kids to go to college. If college gets more expensive, you might—of necessity—send them to a worse school or not allow them to complete their degree, but this would feel like a great hardship for your family. And in today’s economy you can’t not send your kids to college.

But this is not true of technology: While there is a case to be made that in today’s society you need a laptop in the house, the fact is that people didn’t used to have those not that long ago, and if they suddenly got a lot cheaper you very well might buy another one.

Well, it just so happens that housing, healthcare, and education have all gotten radically more expensive over time, while technology has gotten radically cheaper. So prima facie, this is looking pretty plausible.

But I wanted to get more precise about it. So here is the index I have constructed. I consider a family of four, two adults, two kids, making the median household income.

To get the median income, I’ll use this FRED series for median household income, then use this table of median federal tax burden to get an after-tax wage. (State taxes vary too much for me to usefully include them.) Since the tax table ends in 2020 which was anomalous, I’m going to extrapolate that 2021-2024 should be about the same as 2019.

I assume the kids go to public school, but the parents are saving up for college; to make the math simple, I’ll assume the family is saving enough for each kid to graduate from with a four-year degree from a public university, and that saving is spread over 16 years of the child’s life. 2*4/16 = 0.5; this means that each year the family needs to come up with 0.5 years of cost of attendance. (I had to get the last few years from here, but the numbers are comparable.)

I assume the family owns two cars—both working full time, they kinda have to—which I amortize over 10 year lifetimes; 2*1/10 = 0.2, so each year the family pays 0.2 times the value of an average midsize car. (The current average new car price is $33226; I then use the CPI for cars to figure out what it was in previous years.)

I assume they pay a 30-year mortgage on the median home; they would pay interest on this mortgage, so I need to factor that in. I’ll assume they pay the average mortgage rate in that year, but I don’t want to have to do a full mortgage calculation (including PMI, points, down payment etc.) for each year, so I’ll say that they amount they pay is (1/30 + 0.5 (interest rate))*(home value) per year, which seems to be a reasonable approximation over the relevant range.

I assume that both adults have a 15-mile commute (this seems roughly commensurate with the current mean commute time of 26 minutes), both adults work 5 days per week, 50 weeks per year, and their cars get the median level of gas mileage. This means that they consume 2*15*2*5*50/(median MPG) = 15000/(median MPG) gallons of gasoline per year. I’ll use this BTS data for gas mileage. I’m intentionally not using median gasoline consumption, because when gas is cheap, people might take more road trips, which is consumption that could be avoided without great hardship when gas gets expensive. I will also assume that the kids take the bus to school, so that doesn’t contribute to the gasoline cost.

That I will multiply by the average price of gasoline in June of that year, which I have from the EIA since 1993. (I’ll extrapolate 1990-1992 as the same as 1993, which is conservative.)

I will assume that the family owns 2 cell phones, 1 computer, and 1 television. This is tricky, because the quality of these tech items has dramatically increased over time.

If you try to measure with equivalent buying power (e.g. a 1 MHz computer, a 20-inch CRT TV), then you’ll find that these items have gotten radically cheaper; $1000 in 1950 would only buy as much TV as $7 today, and a $50 Raspberry Pi‘s 2.4 GHz processor is 150 times faster than the 16 MHz offered by an Apple Powerbook in 1991—despite the latter selling for $2500 nominally. So in dollars per gigahertz, the price of computers has fallen by an astonishing 7,500 times just since 1990.

But I think that’s an unrealistic comparison. The standards for what was considered necessary have also increased over time. I actually think it’s quite fair to assume that people have spent a roughly constant nominal amount on these items: about $500 for a TV, $1000 for a computer, and $500 for a cell phone. I’ll also assume that the TV and phones are good for 5 years while the computer is good for 2 years, which makes the total annual expenditure for 2 phones, a TV, and a computer equal to 2/5*500 + 1/5*500 + 1/2*1000 = 800. This is about what a family must spend every year to feel like they have an adequate amount of digital technology.

I will also assume that the family buys clothes with this equivalent purchasing power, with an index that goes from 166 in 1990 to 177 in 2024—also nearly constant in nominal terms. I’ll multiply that index by $10 because the average annual household spending on clothes is about $1700 today.

I will assume that the family buys the equivalent of five months of infant care per year; they surely spend more than this (in either time or money) when they have actual infants, but less as the kids grow. This amounts to about $5000 today, but was only $1600 in 1990—a 214% increase, or 3.42% per year.

For food expenditure, I’m going to use the USDA’s thrifty plan for June of that year. I’ll use the figures assuming that one child is 6 and the other is 9. I don’t have data before 1994, so I’ll extrapolate that with the average growth rate of 3.2%.

Food expenditures have been at a fairly consistent 11% of disposable income since 1990; so I’m going to include them as 2*11%*40*50*(after-tax median wage) = 440*(after-tax median wage).

The figures I had the hardest time getting were for utilities. It’s also difficult to know what to include: Is Internet access a necessity? Probably, nowadays—but not in 1990. Should I separate electric and natural gas, even though they are partial substitutes? But using these figures I estimate that utility costs rise at about 0.8% per year in CPI-adjusted terms, so what I’ll do is benchmark to $3800 in 2016 and assume that utility costs have risen by (0.8% + inflation rate) per year each year.

Healthcare is also a tough one; pardon the heteronormativity, but for simplicity I’m going to use the mean personal healthcare expenditures for one man and woman (aged 19-44) and one boy and one girl (aged 0-18). Unfortunately I was only able to find that for two-year intervals in the range from 2002 to 2020, so I interpolated and extrapolated both directions assuming the same average growth rate of 3.5%.

So let’s summarize what all is included here:

  • Estimated payment on a mortgage
  • 0.5 years of college tuition
  • amortized cost of 2 cars
  • 7500/(median MPG) gallons of gasoline
  • amortized cost of 2 phones, 1 computer, and 1 television
  • average spending on clothes
  • 11% of income on food
  • Estimated utilities spending
  • Estimated childcare equivalent to five months of infant care
  • Healthcare for one man, one woman, one boy, one girl

There are obviously many criticisms you could make of these choices. If I were writing a proper paper, I would search harder for better data and run robustness checks over the various estimation and extrapolation assumptions. But for these purposes I really just want a ballpark figure, something that will give me a sense of what rising cost of living feels like to most people.

What I found absolutely floored me. Over the range from 1990 to 2024:

  1. The Index of Necessary Expenditure rose by an average of 3.45% per year, almost a full percentage point higher than the average CPI inflation of 2.62% per year.
  2. Over the same period, after-tax income rose at a rate of 3.31%, faster than CPI inflation, but slightly slower than the growth rate of INE.
  3. The Index of Necessary Expenditure was over 100% of median after-tax household income every year except 2020.
  4. Since 2021, the Index of Necessary Expenditure has risen at an average rate of 5.74%, compared to CPI inflation of only 2.66%. In that same time, after-tax income has only grown at a rate of 4.94%.

Point 3 is the one that really stunned me. The only time in the last 34 years that a family of four has been able to actually pay for all necessities—just necessities—on a typical household income was during the COVID pandemic, and that in turn was only because the federal tax burden had been radically reduced in response to the crisis. This means that every single year, a typical American family has been either going further and further into debt, or scrimping on something really important—like healthcare or education.

No wonder people feel like the economy is failing them! It is!

In fact, I can even make sense now of how Trump could convince people with “Are you better off than you were four years ago?” in 2024 looking back at 2020—while the pandemic was horrific and the disruption to the economy was massive, thanks to the US government finally actually being generous to its citizens for once, people could just about actually make ends meet. That one year. In my entire life.

This is why people felt betrayed by Biden’s economy. For the first time most of us could remember, we actually had this brief moment when we could pay for everything we needed and still have money left over. And then, when things went back to “normal”, it was taken away from us. We were back to no longer making ends meet.

When I went into this, I expected to see that the INE had risen faster than both inflation and income, which was indeed the case. But I expected to find that INE was a large but manageable proportion of household income—maybe 70% or 80%—and slowly growing. Instead, I found that INE was greater than 100% of income in every year but one.

And the truth is, I’m not sure I’ve adequately covered all necessary spending! My figures for childcare and utilities are the most uncertain; those could easily go up or down by quite a bit. But even if I exclude them completely, the reduced INE is still greater than income in most years.

Suddenly the way people feel about the economy makes a lot more sense to me.

Inequality-adjusted GDP and median income

Dec 11 JDN 2459925

There are many problems with GDP as a measure of a nation’s prosperity. For one, GDP ignores natural resources and ecological degradation; so a tree is only counted in GDP once it is cut down. For another, it doesn’t value unpaid work, so caring for a child only increases GDP if you are a paid nanny rather than the child’s parents.

But one of the most obvious problems is the use of an average to evaluate overall prosperity, without considering the level of inequality.

Consider two countries. In Alphania, everyone has an income of about $50,000. In Betavia, 99% of people have an income of $1,000 and 1% have an income of $10 million. What is the per-capita GDP of each country? Alphania’s is $50,000 of course; but Betavia’s is $100,990. Does it really make sense to say that Betavia is a more prosperous country? Maybe it has more wealth overall, but its huge inequality means that it is really not at a high level of development. It honestly sounds like an awful place to live.

A much more sensible measure would be something like median income: How much does a typical person have? In Alphania this is still $50,000; but in Betavia it is only $1,000.

Yet even this leaves out most of the actual distribution; by definition a median is only determined by what is the 50th percentile. We could vary all other incomes a great deal without changing the median.

A better measure would be some sort of inequality-adjusted per-capita GDP, which rescales GDP based on the level of inequality in a country. But we would need a good way of making that adjustment.

I contend that the most sensible way would be to adopt some kind of model of marginal utility of income, and then figure out what income would correspond to the overall average level of utility.

In other words, average over the level of happiness that people in a country get from their income, and then figure out what level of income would correspond to that level of happiness. If we magically gave everyone the same amount of money, how much would they need to get in order for the average happiness in the country to remain the same?

This is clearly going to be less than the average level of income, because marginal utility of income is decreasing; a dollar is not worth as much in real terms to a rich person as it is to a poor person. So if we could somehow redistribute all income evenly while keeping the average the same, that would actually increase overall happiness (though, for many reasons, we can’t simply do that).

For example, suppose that utility of income is logarithmic: U = ln(I).

This means that the marginal utility of an additional dollar is inversely proportional to how many dollars you already have: U'(I) = 1/I.

It also means that a 1% gain or loss in your income feels about the same regardless of how much income you have: ln((1+r)Y) = ln(Y) + ln(1+r). This seems like a quite reasonable, maybe even a bit conservative, assumption; I suspect that losing 1% of your income actually hurts more when you are poor than when you are rich.

Then the inequality adjusted GDP Y is a value such that ln(Y) is equal to the overall average level of utility: E[U] = ln(Y), so Y = exp(E[U]).

This sounds like a very difficult thing to calculate. But fortunately, the distribution of actual income seems to quite closely follow a log-normal distribution. This means that when we take the logarithm of income to get utility, we just get back a very nice, convenient normal distribution!

In fact, it turns out that for a log-normal distribution, the following holds: exp(E[ln(Y)]) = median(Y)

The income which corresponds to the average utility turns out to simply be the median income! We went looking for a better measure than median income, and ended up finding out that median income was the right measure all along.

This wouldn’t hold for most other distributions; and since real-world economies don’t perfectly follow a log-normal distribution, a more precise estimate would need to be adjusted accordingly. But the approximation is quite good for most countries we have good data on, so even for the ones we don’t, median income is likely a very good estimate.

The ranking of countries by median income isn’t radically different from the ranking by per-capita GDP; rich countries are still rich and poor countries are still poor. But it is different enough to matter.

Luxembourg is in 1st place on both lists. Scandinavian countries and the US are in the top 10 in both cases. So it’s fair to say that #ScandinaviaIsBetter for real, and the US really is so rich that our higher inequality doesn’t make our median income lower than the rest of the First World.

But some countries are quite different. Ireland looks quite good in per-capita GDP, but quite bad in median income. This is because a lot of the GDP in Ireland is actually profits by corporations that are only nominally headquartered in Ireland and don’t actually employ very many people there.

The comparison between the US, the UK, and Canada seems particularly instructive. If you look at per-capita GDP PPP, the US looks much richer at $75,000 compared to Canada’s $57,800 (a difference of 29% or 26 log points). But if you look at median personal income, they are nearly equal: $19,300 in the US and $18,600 in Canada (3.7% or 3.7 log points).

On the other hand, in per-capita GDP PPP, the UK looks close to Canada at $55,800 (3.6% or 3.6 lp); but in median income it is dramatically worse, at only $14,800 (26% or 23 lp). So Canada and the UK have similar overall levels of wealth, but life for a typical Canadian is much better than life for a typical Briton because of the higher inequality in Britain. And the US has more wealth than Canada, but it doesn’t meaningfully improve the lifestyle of a typical American relative to a typical Canadian.

Sheepskin effect doesn’t prove much

Sep 20 JDN 2459113

The sheepskin effect is the observation that the increase in income from graduating from college after four years, relative going through college for three years, is much higher than the increase in income from simply going through college for three years instead of two.

It has been suggested that this provides strong evidence that education is primarily due to signaling, and doesn’t provide any actual value. In this post I’m going to show why this view is mistaken. The sheepskin effect in fact tells us very little about the true value of college. (Noah Smith actually made a pretty decent argument that it provides evidence against signaling!)

To see this, consider two very simple models.

In both models, we’ll assume that markets are competitive but productivity is not directly observable, so employers sort you based on your education level and then pay a wage equal to the average productivity of people at your education level, compensated for the cost of getting that education.

Model 1:

In this model, people all start with the same productivity, and are randomly assigned by their life circumstances to go to either 0, 1, 2, 3, or 4 years of college. College itself has no long-term cost.

The first year of college you learn a lot, the next couple of years you don’t learn much because you’re trying to find your way, and then in the last year of college you learn a lot of specialized skills that directly increase your productivity.

So this is your productivity after x years of college:

Years of collegeProductivity
010
117
222
325
431

We assumed that you’d get paid your productivity, so these are also your wages.

The increase in income each year goes from +7, to +5, to +3, then jumps up to +6. So if you compare the 4-year-minus-3-year gap (+6) with the 3-year-minus-2-year gap (+3), you get a sheepskin effect.

Model 2:

In this model, college is useless and provides no actual benefits. People vary in their intrinsic productivity, which is also directly correlated with the difficulty of making it through college.

In particular, there are five types of people:

TypeProductivityCost per year of college
0108
1116
2144
3193
4310

The wages for different levels of college education are as follows:

Years of collegeWage
010
117
222
325
431

Notice that these are exactly the same wages as in scenario 1. This is of course entirely intentional. In a moment I’ll show why this is a Nash equilibrium.

Consider the choice of how many years of college to attend. You know your type, so you know the cost of college to you. You want to maximize your net benefit, which is the wage you’ll get minus the total cost of going to college.

Let’s assume that if a given year of college isn’t worth it, you won’t try to continue past it and see if more would be.

For a type-0 person, they could get 10 by not going to college at all, or 17-(1)(8) = 9 by going for 1 year, so they stop.

For a type-1 person, they could get 10 by not going to college at all, or 17-(1)(6) = 11 by going for 1 year, or 22-(2)(6) = 10 by going for 2 years, so they stop.

Filling out all the possibilities yields this table:

Years \ Type01234
01010101010
1911131417
2
10141622
3

131925
4


1930

I’d actually like to point out that it was much harder to find numbers that allowed me to make the sheepskin effect work in the second model, where education was all signaling. In the model where education provides genuine benefit, all I need to do is posit that the last year of college is particularly valuable (perhaps because high-level specialized courses are more beneficial to productivity). I could pretty much vary that parameter however I wanted, and get whatever magnitude of sheepskin effect I chose.

For the signaling model, I had to carefully calibrate the parameters so that the costs and benefits lined up just right to make sure that each type chose exactly the amount of college I wanted them to choose while still getting the desired sheepskin effect. It took me about two hours of very frustrating fiddling just to get numbers that worked. And that’s with the assumption that someone who finds 2 years of college not worth it won’t consider trying for 4 years of college (which, given the numbers above, they actually might want to), as well as the assumption that when type-3 individuals are indifferent between staying and dropping out they drop out.

And yet the sheepskin effect is supposed to be evidence that the world works like the signaling model?

I’m sure a more sophisticated model could make the signaling explanation a little more robust. The biggest limitation of these models is that once you observe someone’s education level, you immediately know their true productivity, whether it came from college or not. Realistically we should be allowing for unobserved variation that can’t be sorted out by years of college.

Maybe it seems implausible that the last year of college is actually more beneficial to your productivity than the previous years. This is probably the intuition behind the idea that sheepskin effects are evidence of signaling rather than genuine learning.

So how about this model?

Model 3:

As in the second model, there are four types of people, types 0, 1, 2, 3, and 4. They all start with the same level of productivity, and they have the same cost of going to college; but they get different benefits from going to college.

The problem is, people don’t start out knowing what type they are. Nor can they observe their productivity directly. All they can do is observe their experience of going to college and then try to figure out what type they must be.

Type 0s don’t benefit from college at all, and they know they are type 0; so they don’t go to college.

Type 1s benefit a tiny amount from college (+1 productivity per year), but don’t realize they are type 1s until after one year of college.

Type 2s benefit a little from college (+2 productivity per year), but don’t realize they are type 2s until after two years of college.

Type 3s benefit a moderate amount from college (+3 productivity per year), but don’t realize they are type 3s until after three years of college.

Type 4s benefit a great deal from college (+5 productivity per year), but don’t realize they are type 4s until after three years of college.

What then will happen? Type 0s will not go to college. Type 1s will go one year and then drop out. Type 2s will go two years and then drop out. Type 3s will go three years and then drop out. And type 4s will actually graduate.

That results in the following before-and-after productivity:

TypeProductivity before collegeYears of collegeProductivity after college
010010
110111
210214
310319
410430

If each person is paid a wage equal to their productivity, there will be a huge sheepskin effect; wages only go up +1 for 1 year, +3 for 2 years, +5 for 3 years, but then they jump up to +11 for graduation. It appears that the benefit of that last year of college is more than the other three combined. But in fact it’s not; for any given individual, the benefits of college are the same each year. It’s just that college is more beneficial to the people who decided to stay longer.

And I could of course change that assumption too, making the early years more beneficial, or varying the distribution of types, or adding more uncertainty—and so on. But it’s really not hard at all to make a model where college is beneficial and you observe a large sheepskin effect.

In reality, I am confident that some of the observed benefit of college is due to sorting—not the same thing as signaling—rather than the direct benefits of education. The earnings advantage of going to a top-tier school may be as much about the selection of students as they are the actual quality of the education, since once you control for measures of student ability like GPA and test scores those benefits drop dramatically.

Moreover, I agree that it’s worth looking at this: Insofar as college is about sorting or signaling, it’s wasteful from a societal perspective, and we should be trying to find more efficient sorting mechanisms.

But I highly doubt that all the benefits of college are due to sorting or signaling; there definitely are a lot of important things that people learn in college, not just conventional academic knowledge like how to do calculus, but also broader skills like how to manage time, how to work in groups, and how to present ideas to others. Colleges also cultivate friendships and provide opportunities for networking and exposure to a diverse community. Judging by voting patterns, I’m going to go out on a limb and say that college also makes you a better citizen, which would be well worth it by itself.

The truth is, we don’t know exactly why college is beneficial. We certainly know that it is beneficial: Unemployment rates and median earnings are directly sorted by education level. Yes, even PhDs in philosophy and sociology have lower unemployment and higher incomes (on average) than the general population. (And of course PhDs in economics do better still.)

Glorifying superstars glorifies excessive risk

Apr 26 JDN 2458964

Suppose you were offered the choice of the following two gambles; which one would you take?

Gamble A: 99.9% chance of $0; 0.1% chance of $100 million

Gamble B: 10% chance of $50,000; 80% chance of $100,000; 10% chance of $1 million

I think it’s pretty clear that you should choose gamble B.

If you were risk-neutral, the expected payoffs would be $100,000 for gamble A and $185,000 for gamble B. So clearly gamble B is the better deal.

But you’re probably risk-averse. If you have logarithmic utility with a baseline and current wealth of $10,000, the difference is even larger:

0.001*ln(10001) = 0.009

0.1*ln(6) + 0.8*ln(11) + 0.1*ln(101) = 2.56

Yet suppose this is a gamble that a lot of people get to take. And furthermore suppose that what you read about in the news every day is always the people who are the very richest. Then you will read, over and over again, about people who took gamble A and got lucky enough to get the $100 million. You’d probably start to wonder if maybe you should be taking gamble A instead.

This is more or less the world we live in. A handful of billionaires own staggering amounts of wealth, and we are constantly hearing about them. Even aside from the fact that most of them inherited a large portion of it and all of them had plenty of advantages that most of us will never have, it’s still not clear that they were actually smart about taking the paths they did—it could simply be that they got spectacularly lucky.

Or perhaps there’s an even clearer example: Professional athletes. The vast majority of athletes make basically no money at sports. Even most paid athletes are in minor leagues and make only a modest living.

There’s certainly nothing wrong with being an amateur who plays sports for fun. But if you were to invest a large proportion of your time training in sports in the hopes of becoming a professional athlete, you would most likely find yourself gravely disappointed, as your chances of actually getting into the major leagues and becoming a multi-millionaire are exceedingly small. Yet you can probably name at least a few major league athletes who are multi-millionaires—perhaps dozens, if you’re a serious fan—and I doubt you can name anywhere near as many minor league players or players who never made it into paid leagues in the first place.

When we spend all of our time focused on the superstars, what we are effectively assessing is the maximum possible income available on a given career track. And it’s true; the maximum for professional athletes and especially entrepreneurs is extremely high. But the maximum isn’t what you should care about; you should really be concerned about the average or even the median.

And it turns out that the same professions that offer staggeringly high incomes at the very top also tend to be professions with extremely high risk attached. The average income for an athlete is very small; the median is almost certainly zero. Entrepreneurs do better; their average and median income aren’t too much worse than most jobs. But this moderate average comes with a great deal of risk; yes, you could become a billionaire—but far more likely, you could become bankrupt.

This is a deeply perverse result: The careers that our culture most glorifies, the ones that we inspire people to dream about, are precisely those that are the most likely to result in financial ruin.

Realizing this changes your perspective on a lot of things. For instance, there is a common lament that teachers aren’t paid the way professional athletes are. I for one am extremely grateful that this is the case. If teachers were paid like athletes, yes, 0.1% would be millionaires, but only 4.9% would make a decent living, and the remaining 95% would be utterly broke. Indeed, this is precisely what might happen if MOOCs really take off, and a handful of superstar teachers are able to produce all the content while the vast majority of teaching mostly amounts to showing someone else’s slideshows. Teachers are much better off in a world where they almost all make a decent living even though none of them ever get spectacularly rich. (Are many teachers still underpaid? Sure. How do I know this? Because there are teacher shortages. A chronic shortage of something is a surefire sign that its price is too low.) And clearly the idea that we could make all teachers millionaires is just ludicrous: Do you want to pay $1 million a year for your child’s education?

Is there a way that we could change this perverse pattern? Could we somehow make it feel more inspiring to choose a career that isn’t so risky? Well, I doubt we’ll ever get children to dream of being accountants or middle managers. But there are a wide range of careers that are fulfilling and meaningful while still making a decent living—like, well, teaching. Even working in creative arts can be like this: While very few authors are millionaires, the median income for an author is quite respectable. (On the other hand there’s some survivor bias here: We don’t count you as an author if you can’t get published at all.) Software engineers are generally quite satisfied with their jobs, and they manage to get quite high incomes with low risk. I think the real answer here is to spend less time glorifying obscene hoards of wealth and more time celebrating lives that are rich and meaningful.

I don’t know if Jeff Bezos is truly happy. But I do know that you and I are more likely to be happy if instead of trying to emulate him, we focus on making our own lives meaningful.

The real cost of high rent

Jan 26 JDN 2458875

The average daily commute time in the United States is about 26 minutes each way—for a total of 52 minutes every weekday. Public transit commute times are substantially longer in most states than driving commute times: In California, the average driving commute is 28 minutes each way, while the average public transit commute is 51 minutes each way. Adding this up over 5 workdays per week, working 50 weeks per year, means that on average Americans spend over 216 hours each year commuting.

Median annual income in the US is about $33,000. Assuming about 2000 hours of work per year for a full-time job, that’s a wage of $16.50 per hour. This makes the total cost of commute time in the United States over $3500 per worker per year. Multiplied by a labor force of 205 million, this makes the total cost of commute time over $730 billion per year. That’s not even counting the additional carbon emissions and road fatalities. This is all pure waste. The optimal commute time is zero minutes; the closer we can get to that, the better. Telecommuting might finally make this a reality, at least for a large swath of workers. Already over 40% of US workers telecommute at least some of the time.

Let me remind you that it would cost about $200 billion per year to end world hunger. We could end world hunger three times over with the effort we currently waste in commute time.

Where is this cost coming from? Why are commutes so long? The answer is obvious: The rent is too damn high. People have long commutes because they can’t afford to live closer to where they work.

Almost half of all renter households in the US pay more than 30% of their income in rent—and 25% pay more than half of their income. The average household rent in the US is over $1400 per month, almost $17,000 per year—more than the per-capita GDP of China.

Not that buying a home solves the problem: In many US cities the price-to-rent ratio of homes is over 20 to 1, and in Manhattan and San Francisco it’s as high as 50 to 1. If you already bought your home years ago, this is great for you; for the rest of us, not so much. Interestingly, high rents seem to correlate with higher price-to-rent ratios, so it seems like purchase prices are responding even more to whatever economic pressure is driving up rents.

Overall about a third of all US consumer spending is on housing; out of our total consumption spending of $13 trillion, this means we are spending over $4 trillion per year on housing, about the GDP of Germany. Of course, some of this is actually worth spending: Housing costs a lot to build, and provides many valuable benefits.

What should we be spending on housing, if the housing market were competitive and efficient?

I think Chicago’s housing market looks fairly healthy. Homes there go for about $250,000, with prices that are relatively stable; and the price-to-rent ratio is about 20 to 1. Chicago is a large city with a population density of about 6,000 people per square kilometer, so it’s not as if I’m using a tiny rural town as my comparison. If the entire population of the United States were concentrated at the same density as the city of Chicago, we’d all fit in only 55,000 square kilometers—less than the area of West Virginia.
Compare this to the median housing price in California ($550,000), New York ($330,000), or Washington, D.C. ($630,000). There are metro areas with housing prices far above even this: In San Jose the median home price is $1.1 million. I find it very hard to believe that it is literally four times as hard to build homes in San Jose as it is in Chicago. Something is distorting that price—maybe it’s over-regulation, maybe it’s monopoly power, maybe it’s speculation—I’m not sure what exactly, but there’s definitely something out of whack here.

This suggests that a more efficient housing market would probably cut prices in California by 50% and prices in New York by 25%. Since about 40% of all spending in California is on housing, this price change would effectively free up 20% of California’s GDP—and 20% of $3 trillion is $600 billion per year. The additional 8% of New York’s GDP gets us another $130 billion, and we’re already at that $730 billion I calculated for the total cost of commuting, only considering New York and California alone.

This means that the total amount of waste—including both time and money—due to housing being too expensive probably exceeds $1.5 trillion per year. This is an enormous sum of money: We’re spending an Australia here. We could just about pay for a single-payer healthcare system with this.

A more nuanced “Carousel of Progress”

Aug 11 JDN 2458707

I recently got back from a trip to Disney World; while most of the attractions are purely fictional and designed only to entertain, a few are factual and designed to inform and persuade. One of these is the “Carousel of Progress”.

The Carousel of Progress consists of a series of animatronic stages, each representing the lifestyle of a particular historical era. They follow the same family over time, showing what their life is like in each era. When it was originally built, the eras shown were 1900s, 1920s, 1940s, and 1960s; but over time they have updated the “present day” stage, and now they are 1900s, 1920s, 1940s, and 1990s. The aim of the attraction is to show how technology has made our lives better.

The family they show is upper-middle class; this makes sense, as most of the audience probably is as well. But to really understand the progress we have made, we need to also consider the full range of incomes.

In this post I will go through a similar sequence of eras, comparing the lifestyles of not just the middle class, but also the rich and the poor.

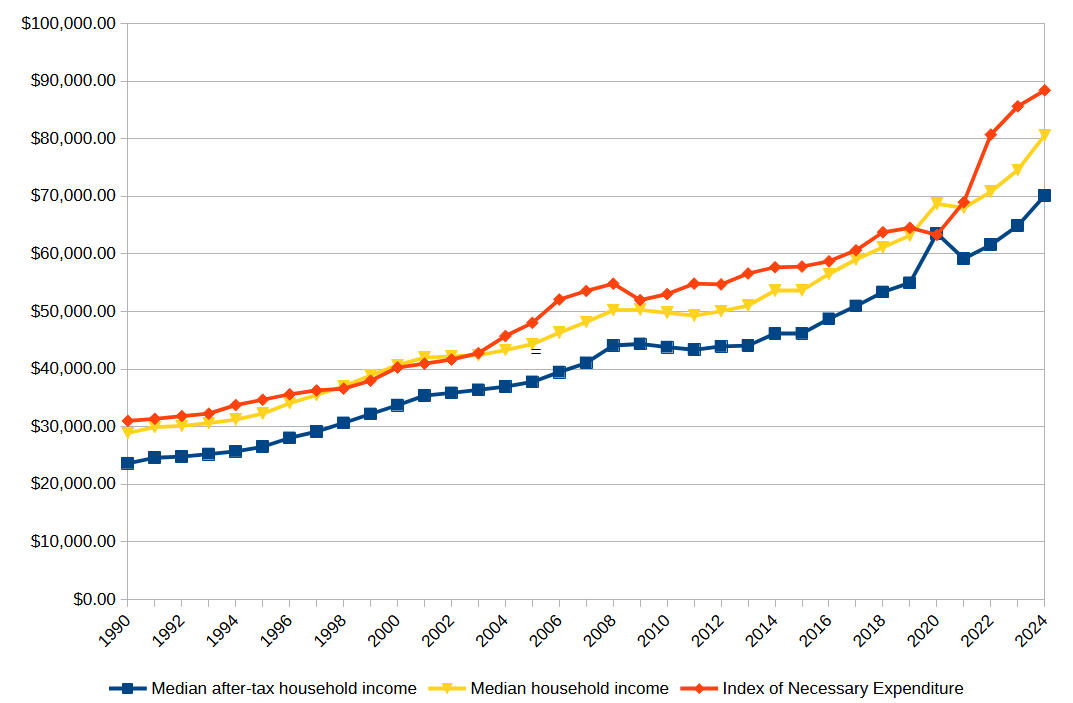
In what follows, I’ve tried to create that, using the best approximate figures on standard of living I could find from each era. The numbers are given in my best guess of the inflation-adjusted standard of living; obviously they’re much more precise in the 1980s to today than they are for earlier eras.

I’ve summarized all these income estimates in the graph below (note the log scale):


Carousel_of_Progress

This means that, after a bumpy ride through the Middle Ages and the Industrial Revolution, we did actually raise the floor—the poor today are about as well off as the middle class in ancient times. But we raised the ceiling an awful lot faster; the rich today are something like a thousand times as rich as the rich in ancient times.


50 AD: Roman Empire

Rich: Patrician

Life is good! My seaside villa is one of the finest in Rome, and my industrious slaves fulfill my every need. At my personal zoo I recently acquired a lion and an elephant. I dine on only the finest foods, including wine from my personal vineyard. An aqueduct feeds directly into my personal baths. The war in Gallia seems to be going well; I look forward to my share of the spoils.

Wealth: $4 million

Income: $200,000

Middle class: Plebeian

Things could be worse. My family has a roof over our heads and bread on our table, so I’m grateful for that. But working all day on the farm is exhausting, and we can’t afford servants to help. My oldest son is a gladiator, though so far he has not attained the highest ranks of the profession. My youngest son was recently drafted into military service in Gallia; I pray for his safety.

Wealth: $10,000

Income: $10,000

Poor: Proletarian

Wealth: $0

Income: $1,000

Living in a hovel I don’t even own with my four children and begging on the streets isn’t an easy life, but at least I’m not a slave. Most of our food is provided by public services. With the war raging in Gallia, one of our small blessings is that we are actually too poor to be drafted into service.

1000 AD: Medieval England

Rich: Duke

While living in a castle is nice, I sometimes wish an end to the frequent raids and border skirmishes that made these high walls necessary. Still, I can’t complain; I own plenty of land, and have plenty of serfs to work it. I am in good favor with the king, and so His Majesty’s army has helped protect my lands against invasion. I have all the feasts, wine, and women a man could ask for.

Wealth: $2 million

Income: $100,000

Middle class: Knight

I can’t complain. It is an honor to be a knight in His Majesty’s army, and I am proud that my family was able to earn enough wealth to buy me a horse, a sword, and the training necessary to reach this rank. I own a little bit of land, but my lord has called upon me for a new campaign, I’m hoping to buy a larger estate with the spoils I earn from it. My family has plenty of food to eat, though if the well runs dry I’m not sure where we’ll get more water.

Wealth: $5,000

Income: $5,000

Poor: Serf

Live grows harder by the day, it seems. My lord keeps demanding more and more work from us, but already the land is producing as much as it can bear. Though we are responsible for planting and harvesting the wheat, often the bread never makes it to my family’s table.

Wealth: $0

Income: $500

1600 AD: Renaissance Venice

Rich: Noble

With the advent of global trade and colonization, wealth has flooded into Venice, and I have had the chance to claim some portion of that flood. I dress in the finest silks, and eat exotic foods from lands as distant as India and China. Servants fulfill my every need. How could life be better?

Wealth: $10 million

Income: $1 million

Middle class: Merchant

I am a proud member of the trader’s guild. Though it our trade ships that carry wealth from across the seas, we often find that wealth passing on up to the nobles, leaving little for ourselves. Still, I have my own land, my own house, and plenty of food for my family.

Wealth: $10,000

Income: $10,000

Poor: The Pebbles

I had a good job working in construction until recently, but I was laid off. I could no longer afford my rent, so now I live on the streets. I feel as though I work constantly but never can find a way to get ahead.

Wealth: $0

Income: $2,000

1750 AD: Pre-Revolutionary France

Rich: Noble

Viva la France! Life is better than ever. Servants do all my work, while the wealth produced by my fields and factories all goes to me. I barely even pay any taxes on my grand estates.

Wealth: $20 million

Income: $2 million

Middle class: Bourgeoisie

I live reasonably well, all things considered. My family has a home and enough food to eat. Still, taxes are becoming increasingly onerous even as the nobles become increasingly detached from the needs of common people like us. Still, we may as well accept it; I doubt things will change any time soon.

Wealth: $15,000

Income: $15,000

Poor: Peasant

Life is hard. I work all day on the farm to make wheat, and then the nobles tax it all away. We have to make our own clothes even as the nobles luxuriate in silks from around the world.

Wealth: $0

Income: $500

1900 AD: United States

Rich

My coal mine has been a roaring success! I am now one of the richest men who has ever lived. I even have my own horseless carriage. Servants are getting more expensive these days, though; even though I’m richer than my grandfather I can’t afford as many servants.

Wealth: $1 billion

Income: $100 million

Middle class

“Well, the robins are back. That’s a sure sign of spring. What year is it? Oh, just before the turn of the century. And believe me, things couldn’t be any better than they are today. Yes sir, we got all the latest things: gas lamps, a telephone, and the latest design in cast iron stoves. That reservoir keeps five gallons of water hot all day on just three buckets of coal. Sure beats chopping wood! And isn’t our new ice box a beauty. Holds 50 pounds of ice. Milk doesn’t sour as quick as is used to. Our dog Rover here keeps the water in the drip pan from overflowing. You know, it wasn’t too long ago we had to carry water from a well. But thanks to progress, we’ve got a pump right here in the kitchen. ‘Course we keep a bucket of water handy to prime it with. Yes sir, we’ve got everything to make life easier. Mother! I was reading about a fellow named Tom Edison, who’s working on an idea for snap on electric lights.”

Wealth: $18,000

Income: $18,000

Poor

I live on the streets most of the time. I eat food out of the garbage. What little money I have is earned by begging. I’m not proud, but it’s all I can do to survive.

Wealth: $0

Income: $2,000

1920 AD: United States

Rich

Life is sweet. My electric company is raking in the dough these days; seems they can hardly find enough copper to lay all the new cables we need to supply all the folks buying into our grid. I have four automobiles now—all top of the line of course. The times, they are a-changin’: Can you believe they gave women the vote? Eh, well, I suppose they can hardly vote worse than us men do already.

Wealth: $5 billion

Income: $500 million

Middle class

“Whew! Hottest summer we’ve had in years. Well, we’ve progressed a long way since the turn of the century 20 years ago. But no one realized then that this would be the age of electricity. Everyone’s using it: farmers, factories, whole towns. With electric streetlights we don’t worry so much about the youngsters being out after dark. And what a difference in our home. We can run as many wires as we need in any direction for Mother’s new electrical servants: electric sewing machine, coffee percolator, toaster, waffle iron, refrigerator, and they all go to work at the click of a switch. Take it easy! You’ll blow a fuse! Queenie! Leave ’em alone. Well, the days of lugging heavy irons from the old cookstove to an ironing board are gone forever. With an electric iron and electric lights, Mother now has time to enjoy her embroidery in the cool of the evening. Right, Mother?”

Wealth: $20,000

Income: $20,000

Poor

Life on the streets is still hard, but at least they’ve got these new soup kitchens to feed me and my family, and with running water in the city we can sometimes get clean water to drink. That newfangled electricity stuff is supposed to be the bee’s knees, but we sure can’t afford it.

Wealth: $0

Income: $4,000

1940 AD: United States

Rich

My steel company is doing extremely well, particularly with the war in Europe raising the price of steel. We just bought our very own airplane; isn’t that marvelous? With Britain under siege and France already fallen to the Krauts, I think we’re gonna end up in the war soon—FDR certainly has been making noises to that effect. If I were poor, I’d be worried about my sons getting drafted; but I’m sure we won’t have to worry about that. No, I’m just looking forward to my stock returns when they start churning out tanks instead of cars in Detroit!

Wealth: $2 billion

Income: $200 million

Middle class

“Well it’s autumn again and the kids are back in school. Thank goodness! Here we are in the frantic forties and the music is better than ever. And it’s amazing how our new kitchen wonders are helping to take over the hard work. Everything is improving. Electric range is better. Refrigerators are bigger and make lots more ice cubes. But my favorite is the electric dishwasher. Now Mother spends less time in the kitchen and I don’t have to dry the dishes anymore. Oh, I spend a lot of time here. Have to. Now that television has arrived, Grandma and Grandpa have taken over my den. Television has changed our lives. It’s brought a whole new world of culture into our home.”

Wealth: $24,000

Income: $24,000

Poor

The Depression was hard on everybody, but I think it was hardest on us poors. This New Deal business seems to be helping out a lot, though; on one of the new construction projects I was able to find work for the first time in months. I’m worried we’re going to be brought into the war soon, but if I get drafted at least that means three squares a day.

Wealth: $0

Income: $4,000

1960 AD: United States

Rich

Running an oil company is not for the faint of heart; they keep adding more onerous regulations every year. Still, profits are bigger than ever. I just wish Uncle Sam would stop taking such a big cut; Commies, all of them. I can barely afford upkeep on my yacht these days with all the taxes.

Wealth: $2 billion

Income: $200 million

Middle class

We just got a color TV at home, and we’ve been watching around the clock. We get all four channels! And my new T-bird is a real beauty; paid a fortune for her, but worth every penny. Society is improving, too; with Rosa Parks and whatnot, I’m guessing things are about to get a lot better for colored folks especially. After that, I’m thinking it’ll be the gays’ turn next; I wonder how long that will take.

Wealth: $30,000

Income: $30,000

Poor

Life is still hard, but I think it’s better now than it’s ever been, even for poor folks like me. Thanks to Welfare, I’m not even as poor as I could be. It’s tough to make ends meet, but at least I can afford a place to live and food to eat. And I’m pretty healthy too: Antibiotics and vaccines mean that we are finally safe from some terrible diseases, like polio. It seems crazy: Just a generation ago the President had a disease that now even folks like me are protected from.

Wealth: $0

Income: $6,000

1980 AD: United States

Rich

They told me I was crazy to invest in these “personal computing machines”, but I saw the writing on the wall. Computers are the future, man. They’re gonna be everywhere, and do everything. We’re gonna have robots and flying cars, and if I have anything to say about it, I’m gonna own the factories that make them.

Wealth: $5 billion

Income: $500 million

Middle class

We have our own PC now. I use it for work, but my kids use it mostly for computer games. I still can’t beat my daughter at Pong, but I can at least hold my own at Pac-Man these days. I hear that programming skills are going to be in high demand soon, so I’ve been trying to teach the kids BASIC.

Wealth: $50,000

Income: $50,000

Poor

Nixon’s Welfare “reform” really hit my family hard. If I don’t find work soon, they’re going to cut my benefits; but if I could find work, what would I need benefits for? Jimmy Carter made some things better, but it doesn’t look like he’ll be re-elected. Can you believe that old actor Ronald Reagan is running?

Wealth: $0

Income: $8,000

2000 AD: United States

Rich

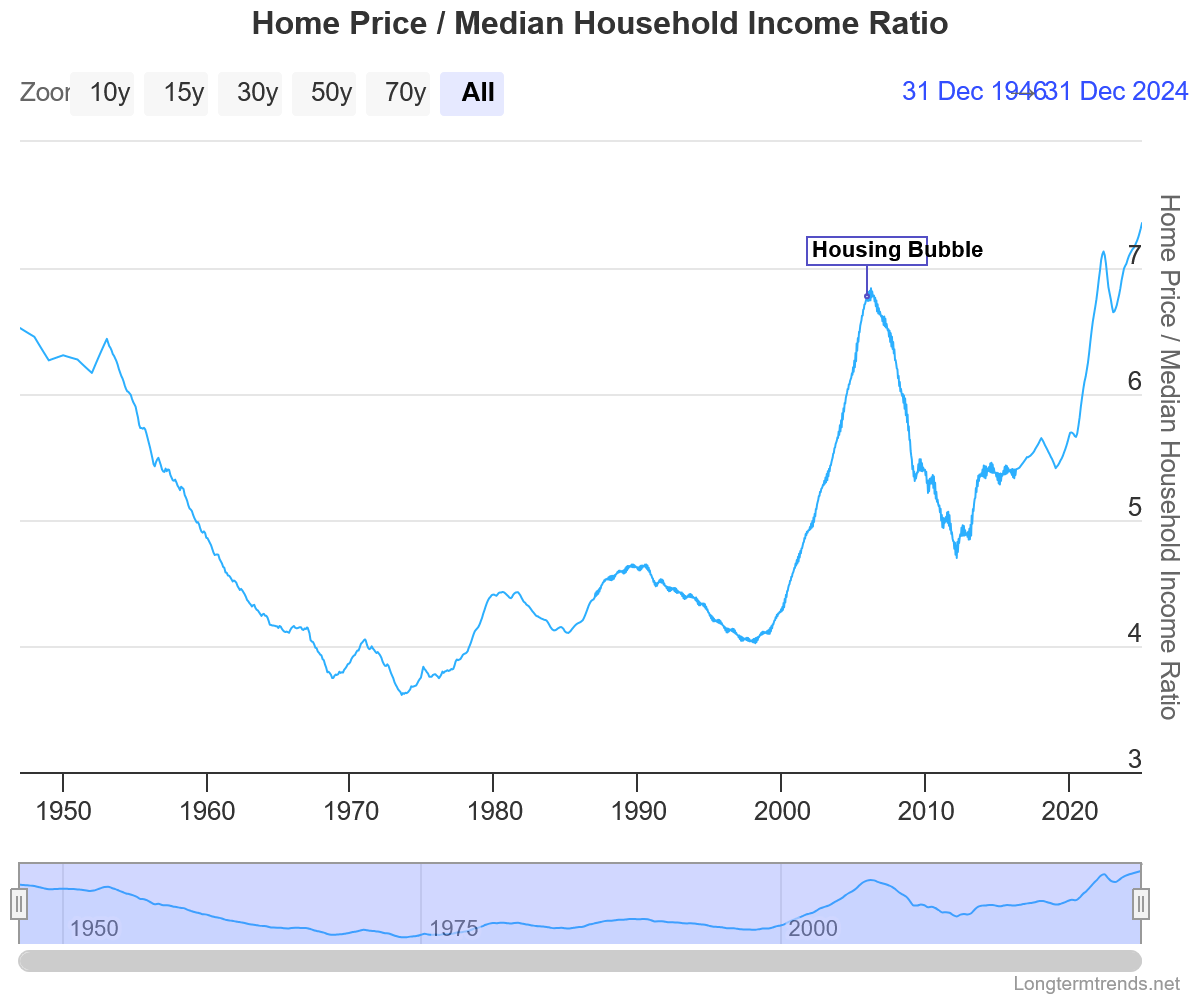
I sure played my cards right in the stock market, buying those tech firms just before the Internet boom really hit. Now I have my own jet and I’m thinking of buying a yacht. Maybe I’ll diversify into real estate; it looks like housing prices are heading north.

Wealth: $10 billion

Income: $1 billion

Middle class

Our home has almost doubled in value since we bought it; we took some of that out as a home equity loan, which helped us buy laptops for our kids. It’s amazing what they can do now; we used to have a big clunky desktop, and these little laptops would run circles around it. We also installed a 56k modem; I’m a little worried about what effect the Internet will have on the kids, but it seems like that’s where everything is going.

Wealth: $60,000

Income: $60,000

Poor

I hate working in fast food, but it beats not working at all. I really wish they’d raise minimum wage though; once you figure in inflation, we’re actually making less than people did ten years ago. I think I qualify for Welfare or something, but the paperwork has gotten so crazy I couldn’t even deal with it. I’m just trying to get by on what I make at the burger joint.

Wealth: $0

Income: $10,000

2020 AD: United States, Present Day

Rich

I knew my app startup would be a success, but even I couldn’t have predicted we’d make it this far. Bought out by Apple for $40 billion? I could hardly have dreamed it myself. I am living the high life; I’ve got my own helicopter now, and a yacht 50 feet long (#lifestyle #swag!). I just upgraded my Google Glass to the new model; it is awesome AF. I think I might move out of the Bay Area and get myself a mansion in Beverly Hills.

Wealth: $20 billion

Income: $2 billion

Middle class

Why is rent so expensive? And how am I ever going to pay off these student loans? After college I managed to land an office job because I’m pretty good with Excel, but it’s still tough to make ends meet. Smartphones are cool and all, but it would be nice to actually own my own home. I think my parents had planned for me to inherit theirs, but we lost it in the subprime crash. Eh, things could be worse. #FirstWorldProblems.

Wealth: $62,000

Income: $62,000

Poor

Things were really bad a few years ago, but they seem to be picking up a little now; I’ve been able to find a job, at least. But it doesn’t pay well; I can’t barely afford rent. I don’t have what they call “marketable skills”, I guess. I should have gone back to school, probably, but I didn’t want to have to deal with student loans. Maybe things will be better once Trump finally gets out of office.

Wealth: $0

Income: $12,000

2040 AD: United States, Cyberpunk Future

Rich

I guess I picked out the right crypto to buy, because it gave me enough to buy my own AI company and now I’m rolling in it. My new helicopter is one of those twin-turbofan models that runs on fuel cells—I was sick of paying carbon tax to fuel up the old kerosene model. I just got cybernetic implants: No phone to carry around, nothing to get lost! I hear they’re working on going to neural interface soon, so we won’t even need to wave our hands around to use them.

Wealth: $40 billion

Income: $4 billion

Middle-class

I used to have a nice job in data analysis, but they automated most of it and outsourced the rest. Now I work for a different corp doing customer service, because that’s the only thing humans seem to still be good for. I have to admit the corps have done some good things for us, though; my daughter was born blind but now she’s got artificial eyes. (Of course, how will we ever pay off those medical debts?) And I really wish someone had done something about climate change sooner; summers these days are absolutely unbearable.

Wealth: $65,000

Income: $65,000

Poor

Wealth: $0

Income: $15,000

I lost my trucking job to a robot, can you believe that? But how am I supposed to compete with 22 hours of daily uptime? Basic income is just about all the money I have. I haven’t been able to find steady work in years. I should have gone to college and studied CS, probably; it seems like salaries in AI get higher every year.

Why do we need “publish or perish”?

June 23 JDN 2458658

This question may seem a bit self-serving, coming from a grad student who is struggling to get his first paper published in a peer-reviewed journal. But given the deep structural flaws in the academic publishing system, I think it’s worth taking a step back to ask just what peer-reviewed journals are supposed to be accomplishing.

The argument is often made that research journals are a way of sharing knowledge. If this is their goal, they have utterly and totally failed. Most papers are read by only a handful of people. When scientists want to learn about the research their colleagues are doing, they don’t read papers; they go to conferences to listen to presentations and look at posters. The way papers are written, they are often all but incomprehensible to anyone outside a very narrow subfield. When published by proprietary journals, papers are often hidden behind paywalls and accessible only through universities. As a knowledge-sharing mechanism, the peer-reviewed journal is a complete failure.

But academic publishing serves another function, which in practice is its only real function: Peer-reviewed publications are a method of evaluation. They are a way of deciding which researchers are good enough to be hired, get tenure, and receive grants. Having peer-reviewed publications—particularly in “top journals”, however that is defined within a given field—is a key metric that universities and grant agencies use to decide which researchers are worth spending on. Indeed, in some cases it seems to be utterly decisive.

We should be honest about this: This is an absolutely necessary function. It is uncomfortable to think about the fact that we must exclude a large proportion of competent, qualified people from being hired or getting tenure in academia, but given the large number of candidates and the small amounts of funding available, this is inevitable. We can’t hire everyone who would probably be good enough. We can only hire a few, and it makes sense to want those few to be the best. (Also, don’t fret too much: Even if you don’t make it into academia, getting a PhD is still a profitable investment. Economists and natural scientists do the best, unsurprisingly; but even humanities PhDs are still generally worth it. Median annual earnings of $77,000 is nothing to sneeze at: US median household income is only about $60,000. Humanities graduates only seem poor in relation to STEM or professional graduates; they’re still rich compared to everyone else.)

But I think it’s worth asking whether the peer review system is actually selecting the best researchers, or even the best research. Note that these are not the same question: The best research done in graduate school might not necessarily reflect the best long-run career trajectory for a researcher. A lot of very important, very difficult questions in science are just not the sort of thing you can get a convincing answer to in a couple of years, and so someone who wants to work on the really big problems may actually have a harder time getting published in graduate school or as a junior faculty member, even though ultimately work on the big problems is what’s most important for society. But I’m sure there’s a positive correlation overall: The kind of person who is going to do better research later is probably, other things equal, going to do better research right now.

Yet even accepting the fact that all we have to go on in assessing what you’ll eventually do is what you have already done, it’s not clear that the process of publishing in a peer-reviewed journal is a particularly good method of assessing the quality of research. Some really terrible research has gotten published in journals—I’m gonna pick on Daryl Bem, because he’s the worst—and a lot of really good research never made it into journals and is languishing on old computer hard drives. (The term “file drawer problem” is about 40 years obsolete; though to be fair, it was in fact coined about 40 years ago.)

That by itself doesn’t actually prove that journals are a bad mechanism. Even a good mechanism, applied to a difficult problem, is going to make some errors. But there are a lot of things about academic publishing, at least as currently constituted, that obviously don’t seem like a good mechanism, such as for-profit publishers, unpaid reviewiers, lack of double-blinded review, and above all, the obsession with “statistical significance” that leads to p-hacking.

Each of these problems I’ve listed has a simple fix (though whether the powers that be actually are willing to implement it is a different question: Questions of policy are often much easier to solve than problems of politics). But maybe we should ask whether the system is even worth fixing, or if it should simply be replaced entirely.

While we’re at it, let’s talk about the academic tenure system, because the peer-review system is largely an evaluation mechanism for the academic tenure system. Publishing in top journals is what decides whether you get tenure. The problem with “Publish or perish” isn’t the “publish”; it’s the perish”. Do we even need an academic tenure system?

The usual argument for academic tenure concerns academic freedom: Tenured professors have job security, so they can afford to say things that may be controversial or embarrassing to the university. But the way the tenure system works is that you only have this job security after going through a long and painful gauntlet of job insecurity. You have to spend several years prostrating yourself to the elders of your field before you can get inducted into their ranks and finally be secure.

Of course, job insecurity is the norm, particularly in the United States: Most employment in the US is “at-will”, meaning essentially that your employer can fire you for any reason at any time. There are specifically illegal reasons for firing (like gender, race, and religion); but it’s extremely hard to prove wrongful termination when all the employer needs to say is, “They didn’t do a good job” or “They weren’t a team player”. So I can understand how it must feel strange for a private-sector worker who could be fired at any time to see academics complain about the rigors of the tenure system.

But there are some important differences here: The academic job market is not nearly as competitive as the private sector job market. There simply aren’t that many prestigious universities, and within each university there are only a small number of positions to fill. As a result, universities have an enormous amount of power over their faculty, which is why they can get away with paying adjuncts salaries that amount to less than minimum wage. (People with graduate degrees! Making less than minimum wage!) At least in most private-sector labor markets in the US, the market is competitive enough that if you get fired, you can probably get hired again somewhere else. In academia that’s not so clear.

I think what bothers me the most about the tenure system is the hierarchical structure: There is a very sharp divide between those who have tenure, those who don’t have it but can get it (“tenure-track”), and those who can’t get it. The lines between professor, associate professor, assistant professor, lecturer, and adjunct are quite sharp. The higher up you are, the more job security you have, the more money you make, and generally the better your working conditions are overall. Much like what makes graduate school so stressful, there are a series of high-stakes checkpoints you need to get through in order to rise in the ranks. And several of those checkpoints are based largely, if not entirely, on publication in peer-reviewed journals.

In fact, we are probably stressing ourselves out more than we need to. I certainly did for my advancement to candidacy; I spent two weeks at such a high stress level I was getting migraines every single day (clearly on the wrong side of the Yerkes-Dodson curve), only to completely breeze through the exam.

I think I might need to put this up on a wall somewhere to remind myself:

Most grad students complete their degrees, and most assistant professors get tenure.

The real filters are admissions and hiring: Most applications to grad school are rejected (though probably most graduate students are ultimately accepted somewhere—I couldn’t find any good data on that in a quick search), and most PhD graduates do not get hired on the tenure track. But if you can make it through those two gauntlets, you can probably make it through the rest.

In our current system, publications are a way to filter people, because the number of people who want to become professors is much higher than the number of professor positions available. But as an economist, this raises a very big question: Why aren’t salaries falling?

You see, that’s how markets are supposed to work: When supply exceeds demand, the price is supposed to fall until the market clears. Lower salaries would both open up more slots at universities (you can hire more faculty with the same level of funding) and shift some candidates into other careers (if you can get paid a lot better elsewhere, academia may not seem so attractive). Eventually there should be a salary point at which demand equals supply. So why aren’t we reaching it?

Well, it comes back to that tenure system. We can’t lower the salaries of tenured faculty, not without a total upheaval of the current system. So instead what actually happens is that universities switch to using adjuncts, who have very low salaries indeed. If there were no tenure, would all faculty get paid like adjuncts? No, they wouldn’tbecause universities would have all that money they’re currently paying to tenured faculty, and all the talent currently locked up in tenured positions would be on the market, driving up the prevailing salary. What would happen if we eliminated tenure is not that all salaries would fall to adjunct level; rather, salaries would all adjust to some intermediate level between what adjuncts currently make and what tenured professors currently make.

What would the new salary be, exactly? That would require a detailed model of the supply and demand elasticities, so I can’t tell you without starting a whole new research paper. But a back-of-the-envelope calculation would suggest something like the overall current median faculty salary. This suggests a median salary somewhere around $75,000. This is a lot less than some professors make, but it’s also a lot more than what adjuncts make, and it’s a pretty good living overall.

If the salary for professors fell, the pool of candidates would decrease, and we wouldn’t need such harsh filtering mechanisms. We might decide we don’t need a strict evaluation system at all, and since the knowledge-sharing function of journals is much better served by other means, we could probably get rid of them altogether.

Of course, who am I kidding? That’s not going to happen. The people who make these rules succeeded in the current system. They are the ones who stand to lose high salaries and job security under a reform policy. They like things just the way they are.

Green New Deal Part 3: Guaranteeing education and healthcare is easy—why aren’t we doing it?

Apr 21 JDN 2458595

Last week was one of the “hard parts” of the Green New Deal. Today it’s back to one of the “easy parts”: Guaranteed education and healthcare.

“Providing all people of the United States with – (i) high-quality health care; […]

“Providing resources, training, and high-quality education, including higher education, to all people of the United States.”

Many Americans seem to think that providing universal healthcare would be prohibitively expensive. In fact, it would have literally negative net cost.
The US currently has the most bloated, expensive, inefficient healthcare system in the entire world. We spend almost $10,000 per person per year on healthcare, and get outcomes no better than France or the UK where they spend less than $5,000.
In fact, our public healthcare expenditures are currently higher than almost every other country. Our private expenditures are therefore pure waste; all they are doing is providing returns for the shareholders of corporations. If we were to simply copy the UK National Health Service and spend money in exactly the same way as they do, we would spend the same amount in public funds and almost nothing in private funds—and the UK has a higher mean lifespan than the US.
This is absolutely a no-brainer. Burn the whole system of private insurance down. Copy a healthcare system that actually works, like they use in every other First World country.
It wouldn’t even be that complicated to implement: We already have a single-payer healthcare system in the US; it’s called Medicare. Currently only old people get it; but old people use the most healthcare anyway. Hence, Medicare for All: Just lower the eligibility age for Medicare to 18 (if not zero). In the short run there would be additional costs for the transition, but in the long run we would save mind-boggling amounts of money, all while improving healthcare outcomes and extending our lifespans. Current estimates say that the net savings of Medicare for All would be about $5 trillion over the next 10 years. We can afford this. Indeed, the question is, as it was for infrastructure: How can we afford not to do this?
Isn’t this socialism? Yeah, I suppose it is. But healthcare is one of the few things that socialist countries consistently do extremely well. Cuba is a socialist country—a real socialist country, not a social democratic welfare state like Norway but a genuinely authoritarian centrally-planned economy. Cuba’s per-capita GDP PPP is a third of ours. Yet their life expectancy is actually higher than ours, because their healthcare system is just that good. Their per-capita healthcare spending is one-fourth of ours, and their health outcomes are better. So yeah, let’s be socialist in our healthcare. Socialists seem really good at healthcare.
And this makes sense, if you think about it. Doctors can do their jobs a lot better when they’re focused on just treating everyone who needs help, rather than arguing with insurance companies over what should and shouldn’t be covered. Preventative medicine is extremely cost-effective, yet it’s usually the first thing that people skimp on when trying to save money on health insurance. A variety of public health measures (such as vaccination and air quality regulation) are extremely cost-effective, but they are public goods that the private sector would not pay for by itself.
It’s not as if healthcare was ever really a competitive market anyway: When you get sick or injured, do you shop around for the best or cheapest hospital? How would you even go about that, when they don’t even post most of their prices and what prices they post are often wildly different than what you’ll actually pay?
The only serious argument I’ve heard against single-payer healthcare is a moral one: “Why should I have to pay for other people’s healthcare?” Well, I guess, because… you’re a human being? You should care about other human beings, and not want them to suffer and die from easily treatable diseases?
I don’t know how to explain to you that you should care about other people.

Single-payer healthcare is not only affordable: It would be cheaper and better than what we are currently doing. (In fact, almost anything would be cheaper and better than what we are currently doing—Obamacare was an improvement over the previous mess, but it’s still a mess.)
What about public education? Well, we already have that up to the high school level, and it works quite well.
Contrary to popular belief, the average public high school has better outcomes in terms of test scores and college placements than the average private high school. There are some elite private schools that do better, but they are extraordinarily expensive and they self-select only the best students. Public schools have to take all students, and they have a limited budget; but they have high quality standards and they require their teachers to be certified.
The flaws in our public school system are largely from it being not public enough, which is to say that schools are funded by their local property taxes instead of having their costs equally shared across whole states. This gives them the same basic problem as private schools: Rich kids get better schools.
If we removed that inequality, our educational outcomes would probably be among the best in the world—indeed, in our most well-funded school districts, they are. The state of Massachusetts which actually funds their public schools equally and well, gets international test scores just as good as the supposedly “superior” educational systems of Asian countries. In fact, this is probably even unfair to Massachusetts, as we know that China specifically selects the regions that have the best students to be the ones to take these international tests. Massachusetts is the best the US has to offer, but Shanghai is also the best China has to offer, so it’s only fair we compare apples to apples.
Public education has benefits for our whole society. We want to have a population of citizens, workers, and consumers who are well-educated. There are enormous benefits of primary and secondary education in terms of reducing poverty, improving public health, and increased economic growth.
So there’s my impassioned argument for why we should continue to support free, universal public education up to high school.
When it comes to college, I can’t be quite so enthusiastic. While there are societal benefits of college education, most of the benefits of college accrue to the individuals who go to college themselves.
The median weekly income of someone with a high school diploma is about $730; with a bachelor’s degree this rises to $1200; and with a doctoral or professional degree it gets over $1800. Higher education also greatly reduces your risk of being unemployed; while about 4% of the general population is unemployed, only 1.5% of people with doctorates or professional degrees are. Add that up over all the weeks of your life, and it’s a lot of money.
The net present value of a college education has been estimated at approximately $1 million. This result is quite sensitive to the choice of discount rate; at a higher discount rate you can get the net present value as “low” as $250,000.
With this in mind, the fact that the median student loan debt for a college graduate is about $30,000 doesn’t sound so terrible, does it? You’re taking out a loan for $30,000 to get something that will earn you between $250,000 and $1 million over the course of your life.
There is some evidence that having student loans delays homeownership; but this is a problem with our mortgage system, not our education system. It’s mainly the inability to finance a down payment that prevents people from buying homes. We should implement a system of block grants for first-time homeowners that gives them a chunk of money to make a down payment, perhaps $50,000. This would cost about as much as the mortgage interest tax deduction which mainly benefits the upper-middle class.
Higher education does have societal benefits as well. Perhaps the starkest I’ve noticed is how categorically higher education decided people’s votes on Donald Trump: Counties with high rates of college education almost all voted for Clinton, and counties with low rates of college education almost all voted for Trump. This was true even controlling for income and a lot of other demographic factors. Only authoritarianism, sexism and racism were better predictors of voting for Trump—and those could very well be mediating variables, if education reduces such attitudes.
If indeed it’s true that higher education makes people less sexist, less racist, less authoritarian, and overall better citizens, then it would be worth every penny to provide universal free college.
But it’s worth noting that even countries like Germany and Sweden which ostensibly do that don’t really do that: While college tuition is free for Swedish citizens and Germany provides free college for all students of any nationality, nevertheless the proportion of people in Sweden and Germany with bachelor’s degrees is actually lower than that of the United States. In Sweden the gap largely disappears if you restrict to younger cohorts—but in Germany it’s still there.
Indeed, from where I’m sitting, “universal free college” looks an awful lot like “the lower-middle class pays for the upper-middle class to go to college”. Social class is still a strong predictor of education level in Sweden. Among OECD countries, education seems to be the best at promoting upward mobility in Australia, and average college tuition in Australia is actually higher than average college tuition in the US (yes, even adjusting for currency exchange: Australian dollars are worth only slightly less than US dollars).
What does Australia do? They have a really good student loan system. You have to reach an annual income of about $40,000 per year before you need to make payments at all, and the loans are subsidized to be interest-free. Once you do owe payments, the debt is repaid at a rate proportional to your income—so effectively it’s not a debt at all but an equity stake.
In the US, students have been taking the desperate (and very cyberpunk) route of selling literal equity stakes in their education to Wall Street banks; this is a terrible idea for a hundred reasons. But having the government have something like an equity stake in students makes a lot of sense.
Because of the subsidies and generous repayment plans, the Australian government loses money on their student loan system, but so what? In order to implement universal free college, they would have spent an awful lot more than they are losing now. This way, the losses are specifically on students who got a lot of education but never managed to raise their income high enough—which means the government is actually incentivized to improve the quality of education or job-matching.
The cost of universal free college is considerable: That $1.3 trillion currently owed as student loans would be additional government debt or tax liability instead. Is this utterly unaffordable? No. But it’s not trivial either. We’re talking about roughly $60 billion per year in additional government spending, a bit less than what we currently spend on food stamps. An expenditure like that should have a large public benefit (as food stamps absolutely, definitely do!); I’m not convinced that free college would have such a benefit.
It would benefit me personally enormously: I currently owe over $100,000 in debt (about half from my undergrad and half from my first master’s). But I’m fairly privileged. Once I finally make it through this PhD, I can expect to make something like $100,000 per year until I retire. I’m not sure that benefiting people like me should be a major goal of public policy.
That said, I don’t think universal free college is a terrible policy. Done well, it could be a good thing. But it isn’t the no-brainer that single-payer healthcare is. We can still make sure that students are not overburdened by debt without making college tuition actually free.