The necessitization of American consumption

Dec6 JDN 2459190

Why do we feel poorer than our parents?

Over the last 20 years, real per-capita GDP has risen from $46,000 to $56,000 (in 2012 dollars):

It’s not just increasing inequality (though it is partly that); real median household income has increased over the same period from $62,500 to $68,700 (in 2019 dollars):

The American Enterprise Institute has utterly the wrong interpretation of what’s going on here, but their graph is actually quite informative if you can read it without their ideological blinders:

Over the past 20 years, some industries have seen dramatic drops in prices, such as televisions, cellphones, toys, and computer software. Other industries have seen roughly constant prices, such as cars, clothing, and furniture. Still other industries have seen modest increases in prices that tracked overall inflation, such as housing and food. And then there are some industries where prices have exploded to staggering heights, such as childcare, college education, and hospital services.

Since wages basically kept up with inflation, this is the relevant comparison: A product or service is more expensive in real terms if its price grew faster than inflation.

It’s not inherently surprising that some prices would rise faster than inflation and some would rise slower; indeed, it would be shocking if that were not the case, since inflation essentially just is an average of all price changes over time. But if you look closely at the kinds of things that got cheaper versus more expensive, you can begin to see why the statistics keep saying we are getting richer but we don’t feel any richer.

The things that increased the most in price are things you basically can’t do without: Education, childcare, and healthcare. Yes, okay, theoretically you could do without these things, but the effects on your life would be catastrophic—indeed, going without healthcare could literally kill you. They are necessities.

The things that decreased the most in price are things that people have done without for most of human history: Cellphones, software, and computer software. They are newfangled high-tech goods that are now ubiquitous, but not at all long ago didn’t even exist. Going without these goods would be inconvenient, but hardly catastrophic. Indeed, they largely only feel as necessary as they are because everyone else already has them. They are luxuries.

This even explains why older generations can be convinced that we are richer than the statistics say: We have all these fancy new high-tech toys that they never had. But what good does that do us when we can’t afford our health insurance?

Housing is also an obvious necessity, and while it has not on average increased in price faster than inflation, this average washes out important geographic variation.

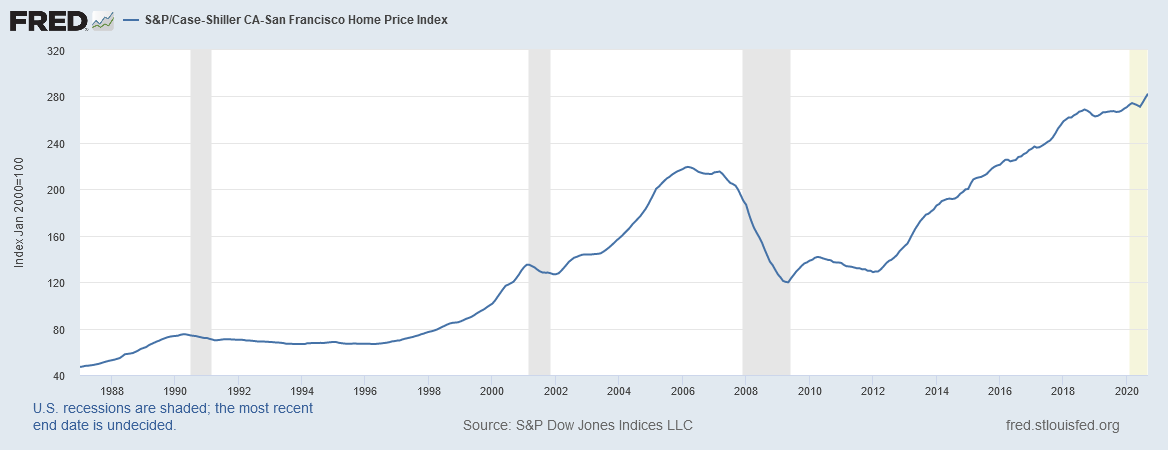
San Francisco has seen housing prices nearly triple in the last 20 years:

Over the same period, Detroit’s housing prices plummeted, then returned to normal, and are now only 30% higher than they were 20 years ago (comparable to inflation):

It’s hardly surprising that the cities where the most people are moving to are the most expensive to live in; that’s basic supply and demand. But the magnitude of the difference is so large that most of us are experiencing rising housing prices, even though on average housing prices aren’t really rising.

Put this all together, and we can see that while by the usual measures our “standard of living” is increasing, our financial situation feels ever more precarious, because more and more of our spending is immediately captured by things we can’t do without. I suggest we call this effect necessitization; our consumption has been necessitized.

Healthcare is the most extreme example: In 1960, healthcare spending was only 5% of US GDP. As recently as 2000, it was 13%. Today, it is 18%. Medical technology has greatly improved over that time period, increasing our life expectancy from 70 years in 1960 to 76 years in 2000 to 78 years today, so perhaps this additional spending is worth it? But if we compare 2000 to 2020, we can see that an additional 5% of GDP in the last 20 years has only bought us two years of life. So we have spent an additional 5% of our income to gain 2.6% more life—that doesn’t sound like such a great deal to me. (Also, if you look closely at the data, most of the gains in life expectancy seem to be from things like antibiotics and vaccines that aren’t a large part of our healthcare spending, while most of the increased spending seems to be on specialists, testing, high-tech equipment, and administrative costs that don’t seem to contribute much to life expectancy.)

Moreover, even if we decide that all this healthcare spending is worth it, it doesn’t make us richer in the usual sense. We have better health, but we don’t have greater wealth or financial security.

AEI sees that the industries with the largest price increases have the most government intervention, and blames the government; this is clearly confusing cause with effect. The reason the government intervenes so much in education and healthcare is because these are necessities and they are getting so expensive. Removing those interventions wouldn’t stop prices from rising; they’d just remove the programs like Medicaid and federal student loans that currently allow most people to (barely) afford them.

But they are right about one thing: Prices have risen much faster in some industries than others, and the services that have gotten the most expensive are generally the services that are most important.

Why have these services gotten so expensive? A major reason seems to be that they are difficult to automate. Manufacturing electronics is very easy to automate—indeed, there’s even a positive feedback loop there: the better you get at automating making electronics, the better you get at automating everything, including making electronics. But automating healthcare and education is considerably more difficult. Yes, there are MOOCs, and automated therapy software, and algorithms will soon be outperforming the average radiologist; but there are a lot of functions that doctors, nurses, and teachers provide that are very difficult to replace with machines or software.

Suppose we do figure out how to automate more functions of education and healthcare; would that solve the problem? Maybe—but only if we really do manage to automate the important parts.

Right now, MOOCs are honestly terrible. The sales pitch is that you can get taught by a world-class professor from anywhere in the world, but the truth is that the things that make someone a world-class professor don’t translate over when you are watching recorded video lectures and doing multiple-choice quizzes. Really good teaching requires direct interaction between teacher and student. Of course, a big lecture hall full of hundreds of students often lacks such interaction—but so much the worse for big lecture halls. If indeed that’s the only way colleges know how to teach, then they deserve to be replaced by MOOCs. But there are better ways of teaching that online courses currently cannot provide, and if college administrators were wise, they would be focusing on pressing that advantage. If this doesn’t happen, and education does become heavily automated, it will be cheaper—but it will also be worse.

Similarly, some aspects of healthcare provision can be automated, but there are clearly major benefits to having actual doctors and nurses physically there to interact with patients. If we want to make healthcare more affordable, we will probably have to find other ways (a single-payer health system comes to mind).

For now, it is at least worth recognizing that there are serious limitations in our usual methods of measuring standard of living; due to effects like necessitization, the statistics can say that we are much richer even as we hardly feel richer at all.

I’m not sure environmentalists understand what the word “consumption” means to economists.

Feb 25 JDN 2458175

Several times now I’ve heard environmentalists repeat variants of this line: “Capitalist economies depend on consumption; therefore capitalism is incompatible with environmental sustainability.”

A recent example comes from this article on QZ arguing that “conscious consumerism” isn’t viable for protecting the environment:

In short, consumption is the backbone of the American economy—which means individual conscious consumerism is basically bound to fail. “70% of GDP in the US is based on household consumption. So all the systems, the market, the institutions, everything is calibrated to maximize consumption,” Brown told me in a later interview. “The whole marketing industry and advertising invents new needs we didn’t know we had.”

Consumption. You keep using that word… I do not think it means what you think it means.

To be clear, let me say that I basically agree that “conscious consumerism” isn’t good enough. There are a few big things you can do to reduce your carbon footprint, like moving to California (or better yet, Scandinavia), becoming vegetarian, driving a hybrid car (or not driving at all), and not flying on airplanes. Aside from that, your consumer choices are not going to have a large impact. There is a huge amount of greenwashing that goes on—products that present themselves as eco-friendly which really aren’t. And these things by themselves are not enough. A 2012 study by the European Roundtable on Sustainable Consumption and Production found little or no difference in long-run carbon footprint between people who claim to be “green consumers” and people who don’t.

Moreover, there is a strong positive correlation between a country’s GDP and its carbon footprint. The list of countries with the highest carbon emissions looks a lot like the list of countries with the highest GDP.

But there is still substantial variation in the ratio of GDP to carbon emissions. Scandinavia does extremely well, at over $5,000 per ton (as does France, thanks to nuclear energy), while most European countries make about $3,000 per ton, the US is at about $2,000 per ton, and the very most carbon-intensive economies like China, the UAE, and South Africa only make about $1,000 per ton. China produces more carbon emissions per capita than Denmark despite having only one-third the standard of living (at purchasing power parity). Emissions also vary a great deal by states within the US; California’s per-capita emissions are comparable to France’s, while Wyoming’s are worse than the UAE’s.

This brings me to my main point, which is that economists don’t mean the same thing by the word “consumption” that environmentalists do. The environmentalist meaning might be closer to common usage: When something is consumed, we think of it as being destroyed, despoiled, degraded. (It’s even an archaic euphemism for tuberculosis.) So I can see why you would think that if our economy is 70% “consumption” that must make capitalism terrible for the environment: An economy that is 70% destruction, despoliation, and degradation does sound pretty bad.

But when economists use the word “consumption”, what we actually mean is private household expenditure. Our economy is 70% “consumption” in the sense that 70% of the dollars spent in GDP are spent by private individuals as opposed to corporations or the government. Of the $19.7 trillion of US GDP, $13.6 trillion was personal consumption expenditures. That’s actually 69%, but it’s okay to round up to 70%. The rest is made up of $3.4 trillion in government spending, $3.3 trillion in private investment, and a loss of $0.6 trillion from our trade deficit.

There’s no particular connection between private household expenditure and destruction, despoliation, or degradation. In fact, the most destructive form of GDP is obviously military spending, which is not counted as “consumption” in the National Income and Product Accounts but rather as “government expenditure”. Military spending is almost pure waste from an ecological perspective; it consumes mind-boggling amounts of fossil fuels in addition to causing death and destruction. The US military produces almost as much total carbon emissions as the entire country of Denmark.

In fact, the vast majority of private household expenditure in highly-developed countries is in the form of services—over $9.2 trillion in the US. The top four categories for expenditure on services in the US are housing/utilities, healthcare, finance, and food service. I can at least see how housing and utilities would be related to ecological impact—concrete and steel are very carbon-intensive, as is electricity if you’re not using nuclear or renewables. But healthcare, finance, and food service? When environmentalists point to the fact that 70% of our economy is consumption as evidence of the fundamental unsustainability of capitalism, this amounts to asserting that the reason we can’t prevent global warming is that there are so many nurses, accountants, and waiters.

Of course, most people don’t quite grasp what economists mean when we use the word “consumption”, so it makes for a nice talking point for environmentalists. You can conjure images of degradation and destruction while citing the respected authority of the National Income and Product Accounts. If you were already left-wing otherwise (as most environmentalists are), you can make it seem as though the problem is capitalism itself, the very structure of an economy built upon “consuming” the Earth.

In reality, there is enormous variation between countries in terms of their carbon efficiency, and in fact the most carbon-efficient nations are all those that have the highest degrees of political and economic freedom—which is to say, social democracies. One can debate whether social democracies like Denmark and Sweden are “truly capitalist”, but they definitely have free-market economies with large private sectors. On a global and historical scale, there’s really not that much difference between Denmark and the United States (compare to the USSR, or China, or Burkina Faso, or Medieval Japan, or Classical Rome). And if the US isn’t capitalist, who is?

My advice? Don’t talk about consumption at all. Talk about carbon emissions. Don’t ignore variation in GDP/carbon ratios: If the world copied China, we’d all have a per-capita income of $15,500 and emissions of 7.6 tons of carbon per person per year; but if the world copied Denmark, we’d all have a per-capita income of $51,000 and emissions of 6.8 tons of carbon per person per year. (Granted, even 6.8 is still too high; the targets I’ve seen say we need to be at about 3.0 by 2030. But Denmark has also been trending downward in emissions, so we could copy them on that too.) Reducing our standard of living wouldn’t save us if it meant being like China, and maintaining it wouldn’t hurt us if it meant being like Denmark.

I definitely agree that focusing on consumer choices isn’t good enough. Focus on policy. Carbon taxes, bans on unconventional extraction (e.g. offshore drilling, fracking), heavy investment in solar and nuclear energy, large reforestation projects, research into soil sequestration and ocean seeding. Demand these things from all politicians of all parties at all levels of government always. Don’t take no for an answer—because millions of people will die if we don’t stop climate change.

But I don’t think nurses, accountants, and waiters are the problem—and it doesn’t hurt for people to become vegetarian and buy hybrid cars.

Two terms in marginal utility of wealth

JDN 2457569

This post is going to be a little wonkier than most; I’m actually trying to sort out my thoughts and draw some public comment on a theory that has been dancing around my head for awhile. The original idea of separating terms in marginal utility of wealth was actually suggested by my boyfriend, and from there I’ve been trying to give it some more mathematical precision to see if I can come up with a way to test it experimentally. My thinking is also influenced by a paper Miles Kimball wrote about the distinction between happiness and utility.

There are lots of ways one could conceivably spend money—everything from watching football games to buying refrigerators to building museums to inventing vaccines. But insofar as we are rational (and we are after all about 90% rational), we’re going to try to spend our money in such a way that its marginal utility is approximately equal across various activities. You’ll buy one refrigerator, maybe two, but not seven, because the marginal utility of refrigerators drops off pretty fast; instead you’ll spend that money elsewhere. You probably won’t buy a house that’s twice as large if it means you can’t afford groceries anymore. I don’t think our spending is truly optimal at maximizing utility, but I think it’s fairly good.

Therefore, it doesn’t make much sense to break down marginal utility of wealth into all these different categories—cars, refrigerators, football games, shoes, and so on—because we already do a fairly good job of equalizing marginal utility across all those different categories. I could see breaking it down into a few specific categories, such as food, housing, transportation, medicine, and entertainment (and this definitely seems useful for making your own household budget); but even then, I don’t get the impression that most people routinely spend too much on one of these categories and not enough on the others.

However, I can think of two quite different fundamental motives behind spending money, which I think are distinct enough to be worth separating.

One way to spend money is on yourself, raising your own standard of living, making yourself more comfortable. This would include both football games and refrigerators, really anything that makes your life better. We could call this the consumption motive, or maybe simply the self-directed motive.

The other way is to spend it on other people, which, depending on your personality can take either the form of philanthropy to help others, or as a means of self-aggrandizement to raise your own relative status. It’s also possible to do both at the same time in various combinations; while the Gates Foundation is almost entirely philanthropic and Trump Tower is almost entirely self-aggrandizing, Carnegie Hall falls somewhere in between, being at once a significant contribution to our society and an obvious attempt to bring praise and adulation to himself. I would also include spending on Veblen goods that are mainly to show off your own wealth and status in this category. We can call this spending the philanthropic/status motive, or simply the other-directed motive.

There is some spending which combines both motives: A car is surely useful, but a Ferrari is mainly for show—but then, a Lexus or a BMW could be either to show off or really because you like the car better. Some form of housing is a basic human need, and bigger, fancier houses are often better, but the main reason one builds mansions in Beverly Hills is to demonstrate to the world that one is fabulously rich. This complicates the theory somewhat, but basically I think the best approach is to try to separate a sort of “spending proportion” on such goods, so that say $20,000 of the Lexus is for usefulness and $15,000 is for show. Empirically this might be hard to do, but theoretically it makes sense.

One of the central mysteries in cognitive economics right now is the fact that while self-reported happiness rises very little, if at all, as income increases, a finding which was recently replicated even in poor countries where we might not expect it to be true, nonetheless self-reported satisfaction continues to rise indefinitely. A number of theories have been proposed to explain this apparent paradox.

This model might just be able to account for that, if by “happiness” we’re really talking about the self-directed motive, and by “satisfaction” we’re talking about the other-directed motive. Self-reported happiness seems to obey a rule that $100 is worth as much to someone with $10,000 as $25 is to someone with $5,000, or $400 to someone with $20,000.

Self-reported satisfaction seems to obey a different rule, such that each unit of additional satisfaction requires a roughly equal proportional increase in income.

By having a utility function with two terms, we can account for both of these effects. Total utility will be u(x), happiness h(x), and satisfaction s(x).

u(x) = h(x) + s(x)

To obey the above rule, happiness must obey harmonic utility, like this, for some constants h0 and r:

h(x) = h0 – r/x

Proof of this is straightforward, though to keep it simple I’ve hand-waved why it’s a power law:

Given

h'(2x) = 1/4 h'(x)

Let

h'(x) = r x^n

h'(2x) = r (2x)^n

r (2x)^n = 1/4 r x^n

n = -2

h'(x) = r/x^2

h(x) = – r x^(-1) + C

h(x) = h0 – r/x

Miles Kimball also has some more discussion on his blog about how a utility function of this form works. (His statement about redistribution at the end is kind of baffling though; sure, dollar for dollar, redistributing wealth from the middle class to the poor would produce a higher gain in utility than redistributing wealth from the rich to the middle class. But neither is as good as redistributing from the rich to the poor, and the rich have a lot more dollars to redistribute.)

Satisfaction, however, must obey logarithmic utility, like this, for some constants s0 and k.

The x+1 means that it takes slightly less proportionally to have the same effect as your wealth increases, but it allows the function to be equal to s0 at x=0 instead of going to negative infinity:

s(x) = s0 + k ln(x)

Proof of this is very simple, almost trivial:

Given

s'(x) = k/x

s(x) = k ln(x) + s0

Both of these functions actually have a serious problem that as x approaches zero, they go to negative infinity. For self-directed utility this almost makes sense (if your real consumption goes to zero, you die), but it makes no sense at all for other-directed utility, and since there are causes most of us would willingly die for, the disutility of dying should be large, but not infinite.

Therefore I think it’s probably better to use x +1 in place of x:

h(x) = h0 – r/(x+1)

s(x) = s0 + k ln(x+1)

This makes s0 the baseline satisfaction of having no other-directed spending, though the baseline happiness of zero self-directed spending is actually h0 – r rather than just h0. If we want it to be h0, we could use this form instead:

h(x) = h0 + r x/(x+1)

This looks quite different, but actually only differs by a constant.

Therefore, my final answer for the utility of wealth (or possibly income, or spending? I’m not sure which interpretation is best just yet) is actually this:

u(x) = h(x) + s(x)

h(x) = h0 + r x/(x+1)

s(x) = s0 + k ln(x+1)

Marginal utility is then the derivatives of these:

h'(x) = r/(x+1)^2

s'(x) = k/(x+1)

Let’s assign some values to the constants so that we can actually graph these.

Let h0 = s0 = 0, so our baseline is just zero.

Furthermore, let r = k = 1, which would mean that the value of $1 is the same whether spent either on yourself or on others, if $1 is all you have. (This is probably wrong, actually, but it’s the simplest to start with. Shortly I’ll discuss what happens as you vary the ratio k/r.)

Here is the result graphed on a linear scale:

Utility_linear

And now, graphed with wealth on a logarithmic scale:

Utility_log

As you can see, self-directed marginal utility drops off much faster than other-directed marginal utility, so the amount you spend on others relative to yourself rapidly increases as your wealth increases. If that doesn’t sound right, remember that I’m including Veblen goods as “other-directed”; when you buy a Ferrari, it’s not really for yourself. While proportional rates of charitable donation do not increase as wealth increases (it’s actually a U-shaped pattern, largely driven by poor people giving to religious institutions), they probably should (people should really stop giving to religious institutions! Even the good ones aren’t cost-effective, and some are very, very bad.). Furthermore, if you include spending on relative power and status as the other-directed motive, that kind of spending clearly does proportionally increase as wealth increases—gotta keep up with those Joneses.

If r/k = 1, that basically means you value others exactly as much as yourself, which I think is implausible (maybe some extreme altruists do that, and Peter Singer seems to think this would be morally optimal). r/k < 1 would mean you should never spend anything on yourself, which not even Peter Singer believes. I think r/k = 10 is a more reasonable estimate.

For any given value of r/k, there is an optimal ratio of self-directed versus other-directed spending, which can vary based on your total wealth.

Actually deriving what the optimal proportion would be requires a whole lot of algebra in a post that probably already has too much algebra, but the point is, there is one, and it will depend strongly on the ratio r/k, that is, the overall relative importance of self-directed versus other-directed motivation.

Take a look at this graph, which uses r/k = 10.

Utility_marginal

If you only have 2 to spend, you should spend it entirely on yourself, because up to that point the marginal utility of self-directed spending is always higher. If you have 3 to spend, you should spend most of it on yourself, but a little bit on other people, because after you’ve spent about 2.2 on yourself there is more marginal utility for spending on others than on yourself.

If your available wealth is W, you would spend some amount x on yourself, and then W-x on others:

u(x) = h(x) + s(W-x)

u(x) = r x/(x+1) + k ln(W – x + 1)

Then you take the derivative and set it equal to zero to find the local maximum. I’ll spare you the algebra, but this is the result of that optimization:

x = – 1 – r/(2k) + sqrt(r/k) sqrt(2 + W + r/(4k))

As long as k <= r (which more or less means that you care at least as much about yourself as about others—I think this is true of basically everyone) then as long as W > 0 (as long as you have some money to spend) we also have x > 0 (you will spend at least something on yourself).

Below a certain threshold (depending on r/k), the optimal value of x is greater than W, which means that, if possible, you should be receiving donations from other people and spending them on yourself. (Otherwise, just spend everything on yourself). After that, x < W, which means that you should be donating to others. The proportion that you should be donating smoothly increases as W increases, as you can see on this graph (which uses r/k = 10, a figure I find fairly plausible):

Utility_donation

While I’m sure no one literally does this calculation, most people do seem to have an intuitive sense that you should donate an increasing proportion of your income to others as your income increases, and similarly that you should pay a higher proportion in taxes. This utility function would justify that—which is something that most proposed utility functions cannot do. In most models there is a hard cutoff where you should donate nothing up to the point where your marginal utility is equal to the marginal utility of donating, and then from that point forward you should donate absolutely everything. Maybe a case can be made for that ethically, but psychologically I think it’s a non-starter.

I’m still not sure exactly how to test this empirically. It’s already quite difficult to get people to answer questions about marginal utility in a way that is meaningful and coherent (people just don’t think about questions like “Which is worth more? $4 to me now or $10 if I had twice as much wealth?” on a regular basis). I’m thinking maybe they could play some sort of game where they have the opportunity to make money at the game, but must perform tasks or bear risks to do so, and can then keep the money or donate it to charity. The biggest problem I see with that is that the amounts would probably be too small to really cover a significant part of anyone’s total wealth, and therefore couldn’t cover much of their marginal utility of wealth function either. (This is actually a big problem with a lot of experiments that use risk aversion to try to tease out marginal utility of wealth.) But maybe with a variety of experimental participants, all of whom we get income figures on?

Whose tax plan makes the most sense?

JDN 2457496

The election for the President of the United States has now come down to four candidates; the most likely winner is Hillary Clinton, but despite claims to the contrary Bernie Sanders could still win the Democratic nomination. On the Republican side Donald Trump holds a small lead over Ted Cruz, and then there’s a small chance that Kasich could win or a new candidate could emerge if neither can win a majority and they go to a brokered convention (I’ve heard Romney and Ryan suggested, and either of them would be far better).

There are a lot of differences between the various candidates, and while it feels partisan to say so I really think it’s pretty obvious that Clinton and Sanders are superior candidates to Trump and Cruz. Trump is a plutocratic crypto-fascist blowhard with no actual qualifications, and Cruz seems to extrude sleaze from his every pore—such that basically nobody who knows him well actually likes him.

In general I’ve preferred Sanders, though when he started talking about trade policy the other day it actually got me pretty worried that he doesn’t appreciate the benefits of free trade. So while I think a lot of Clinton’s plans are kind of lukewarm, I wouldn’t mind if she won, if only because her trade policy is clearly better.

But today I’m going to compare all four candidates in a somewhat wonkier way: Let’s talk about taxes.

Specifically, federal income tax. There are a lot of other types of taxes of course, but federal income tax is the chief source of revenue for the US federal government, as well as the chief mechanism by which the United States engages in redistribution of wealth. I’ll also briefly discuss payroll taxes, which are the second-largest source of federal revenue.
So, I’ve looked up the income tax plans of Hillary Clinton, Bernie Sanders, Donald Trump, and Ted Cruz respectively, and they are summarized below. The first column gives the minimum income threshold for that marginal tax rate (since they vary slightly I’ll be rounding to the nearest thousand). For comparison I’ve included the current income tax system as well. I’m using the rates for an individual filing singly with no deductions for simplicity.

Current system Hillary Clinton Bernie Sanders Donald Trump Ted Cruz
0 10% 10% 10% 0% 0%
9,000 15% 15% 15% 0% 0%
25,000 15% 15% 15% 10% 0%
36,000 25% 25% 25% 10% 10%
37,000 25% 25% 25% 10% 10%
50,000 25% 25% 25% 20% 10%
91,000 28% 28% 28% 20% 10%
150,000 28% 28% 28% 25% 10%
190,000 33% 33% 33% 25% 10%
250,000 33% 33% 37% 25% 10%
412,000 35% 35% 37% 25% 10%
413,000 39.6% 35% 37% 25% 10%
415,000 39.6% 39.6% 37% 25% 10%
500,000 39.6% 39.6% 43% 25% 10%
2,000,000 39.6% 39.6% 48% 25% 10%
5,000,000 39.6% 43.6% 48% 25% 10%
10,000,000 39.6% 43.6% 52% 25% 10%

As you can see, Hillary Clinton’s plan is basically our current system, with some minor adjustments and a slight increase in progressivity.In addition to these slight changes in the income tax code, she also proposes to close some loopholes in corporate taxes, but she basically doesn’t change the payroll tax system at all. Her plan would not change a whole lot, but we know it would work, because our current tax system does work.

Despite calling himself a social democrat and being accused of being a far more extreme sort of socialist, Bernie Sanders offers a tax plan that isn’t very radical either; he makes our income tax system a bit more progressive, especially at very high incomes; but it’s nothing out of the ordinary by historical standards. Sanders’ top rate of 52% is about what Reagan set in his first tax cut plan in 1982, and substantially lower than the about 90% top rates we had from 1942 to 1964 and the about 70% top rates we had from 1965 to 1981. Sanders would also lift the income cap on payroll taxes (which it makes no sense not to do—why would we want payroll taxes to be regressive?) and eliminate the payroll tax deduction for fringe benefits (which is something a lot of economists have been clamoring for).

No, it’s the Republicans who have really radical tax plans. Donald Trump’s plan involves a substantial cut across the board, to rates close to the lowest they’ve ever been in US history, which was during the Roaring Twenties—the top tax rate was 25% from 1925 to 1931. Trump also proposes to cut the corporate tax in half (which I actually like), and eliminate the payroll tax completely—which would only make sense if you absorbed it into income taxes, which he does not.

Ted Cruz’s plan is even more extreme, removing essentially all progressivity from the US tax code and going to a completely flat tax at the nonsensically low rate of 10%. We haven’t had a rate that low since 1915—so these would be literally the lowest income tax rates we’ve had in a century. Ted Cruz also wants to cut the corporate tax rate in half and eliminate payroll taxes, which is even crazier in his case because of how much he would be cutting income tax rates.

To see why this is so bonkers, take a look at federal spending as a portion of GDP over the last century. We spent only about 10% of GDP in 1915; We currently take in $3.25 trillion per year, 17.4% of GDP, and spend $3.70 trillion per year, 19.8% of GDP. So Ted Cruz’s plan was designed for an era in which the federal government spent about half what it does right now. I don’t even see how we could cut spending that far that fast; it would require essentially eliminating Social Security and Medicare, or else huge cuts in just about everything else. Either that, or we’d have to run the largest budget deficit we have since WW2, and not just for the war spending but indefinitely.

Donald Trump’s plan is not quite as ridiculous, but fact-checkers have skewered him for claiming it will be revenue-neutral. No, it would cut revenue by about $1 trillion per year, which would mean either large deficits (and concomitant risk of inflation and interest rate spikes—this kind of deficit would have been good in 2009, but it’s not so great indefinitely) or very large reductions in spending.

To be fair, both Republicans do claim they intend to cut a lot of spending. But they never quite get around to explaining what spending they’ll be cutting. Are you gutting Social Security? Ending Medicare? Cutting the military in half? These are the kinds of things you’d need to do in order to save this much money.

It’s kind of a shame that Cruz set the rate so low, because if he’d proposed a flat tax of say 25% or 30% that might actually make sense. Applied to consumption instead of income, this would be the Fair Tax, which is 23% if calculated like an income tax or 30% if calculated like a sales tax—either way it’s 26 log points. The Fair Tax could actually provide sufficient revenue to support most existing federal spending,

I still oppose it because I want taxes to be progressive (for reasons I’ve explained previously), and the Fair Tax, by applying only to consumption it would be very regressive (poor people often spend more than 100% of their incomes on consumption—financing it on debt—while rich people generally spend about 50%, and the very rich spend even less). It would exacerbate inequality quite dramatically, especially in capital income, which would be completely untaxed. Even a flat income tax like Cruz’s would still hit the poor harder than the rich in real terms.

But I really do like the idea of a very simple, straightforward tax code that has very few deductions so that everyone knows how much they are going to pay and doesn’t have to deal with hours of paperwork to do it. If this lack of deductions is enshrined in law, it would also remove most of the incentives to lobby for loopholes and tax expenditures, making our tax system much fairer and more efficient.

No doubt about it, flat taxes absolutely are hands-down the easiest to compute. Most people would probably have trouble figuring out a formula like r = I^{-p}, though computers have no such problem (my logarithmic tax plan is easier on computers than the present system); but even fifth-graders can multiply something by 25%. There is something very appealing about everyone knowing at all times that they pay in taxes one-fourth of what they get in income. Adding a simple standard deduction for low incomes makes it slightly more complicated, but also makes it a little bit progressive and is totally worth the tradeoff.

His notion of “eliminating the IRS” is ridiculous (we still need the IRS to audit people to make sure they are honest about their incomes!), and I think the downsides of having no power to redistribute wealth via taxes outweigh the benefits of a flat tax, but the benefits are very real. The biggest problem is that Cruz chose a rate that simply makes no sense; there’s no way to make the numbers work out if the rate is only 10%, especially since you’re excluding half the population from being taxed at all.

Hopefully you see how this supports my contention that Clinton and Sanders are the serious candidates while Trump and Cruz are awful; Clinton wants to keep our current tax system, and Sanders wants to make it a bit more progressive, while Trump and Cruz prize cutting taxes and making taxes simple so highly that they forgot to make sure the numbers actually make any sense—or worse, didn’t care.

How much should we save?

JDN 2457215 EDT 15:43.

One of the most basic questions in macroeconomics has oddly enough received very little attention: How much should we save? What is the optimal level of saving?

At the microeconomic level, how much you should save basically depends on what you think your income will be in the future. If you have more income now than you think you’ll have later, you should save now to spend later. If you have less income now than you think you’ll have later, you should spend now and dissave—save negatively, otherwise known as borrowing—and pay it back later. The life-cycle hypothesis says that people save when they are young in order to retire when they are old—in its strongest form, it says that we keep our level of spending constant across our lifetime at a value equal to our average income. The strongest form is utterly ridiculous and disproven by even the most basic empirical evidence, so usually the hypothesis is studied in a weaker form that basically just says that people save when they are young and spend when they are old—and even that runs into some serious problems.

The biggest problem, I think, is that the interest rate you receive on savings is always vastly less than the interest rate you pay on borrowing, which in turn is related to the fact that people are credit-constrainedthey generally would like to borrow more than they actually can. It also has a lot to do with the fact that our financial system is an oligopoly; banks make more profits if they can pay savers less and charge borrowers more, and by colluding with each other they can control enough of the market that no major competitors can seriously undercut them. (There is some competition, however, particularly from credit unions—and if you compare these two credit card offers from University of Michigan Credit Union at 8.99%/12.99% and Bank of America at 12.99%/22.99% respectively, you can see the oligopoly in action as the tiny competitor charges you a much fairer price than the oligopoly beast. 9% means doubling in just under eight years, 13% means doubling in a little over five years, and 23% means doubling in three years.) Another very big problem with the life-cycle theory is that human beings are astonishingly bad at predicting the future, and thus our expectations about our future income can vary wildly from the actual future income we end up receiving. People who are wise enough to know that they do not know generally save more than they think they’ll need, which is called precautionary saving. Combine that with our limited capacity for self-control, and I’m honestly not sure the life-cycle hypothesis is doing any work for us at all.

But okay, let’s suppose we had a theory of optimal individual saving. That would still leave open a much larger question, namely optimal aggregate saving. The amount of saving that is best for each individual may not be best for society as a whole, and it becomes a difficult policy challenge to provide incentives to make people save the amount that is best for society.

Or it would be, if we had the faintest idea what the optimal amount of saving for society is. There’s a very simple rule-of-thumb that a lot of economists use, often called the golden rule (not to be confused with the actual Golden Rule, though I guess the idea is that a social optimum is a moral optimum), which is that we should save exactly the same amount as the share of capital in income. If capital receives one third of income (This figure of one third has been called a “law”, but as with most “laws” in economics it’s really more like the Pirate Code; labor’s share of income varies across countries and years. I doubt you’ll be surprised to learn that it is falling around the world, meaning more income is going to capital owners and less is going to workers.), then one third of income should be saved to make more capital for next year.

When you hear that, you should be thinking: “Wait. Saved to make more capital? You mean invested to make more capital.” And this is the great sleight of hand in the neoclassical theory of economic growth: Saving and investment are made to be the same by definition. It’s called the savings-investment identity. As I talked about in an earlier post, the model seems to be that there is only one kind of good in the world, and you either use it up or save it to make more.

But of course that’s not actually how the world works; there are different kinds of goods, and if people stop buying tennis shoes that doesn’t automatically lead to more factories built to make tennis shoes—indeed, quite the opposite.If people reduce their spending, the products they no longer buy will now accumulate on shelves and the businesses that make those products will start downsizing their production. If people increase their spending, the products they now buy will fly off the shelves and the businesses that make them will expand their production to keep up.

In order to make the savings-investment identity true by definition, the definition of investment has to be changed. Inventory accumulation, products building up on shelves, is counted as “investment” when of course it is nothing of the sort. Inventory accumulation is a bad sign for an economy; indeed the time when we see the most inventory accumulation is right at the beginning of a recession.

As a result of this bizarre definition of “investment” and its equation with saving, we get the famous Paradox of Thrift, which does indeed sound paradoxical in its usual formulation: “A global increase in marginal propensity to save can result in a reduction in aggregate saving.” But if you strip out the jargon, it makes a lot more sense: “If people suddenly stop spending money, companies will stop investing, and the economy will grind to a halt.” There’s still a bit of feeling of paradox from the fact that we tried to save more money and ended up with less money, but that isn’t too hard to understand once you consider that if everyone else stops spending, where are you going to get your money from?

So what if something like this happens, we all try to save more and end up having no money? The government could print a bunch of money and give it to people to spend, and then we’d have money, right? Right. Exactly right, in fact. You now understand monetary policy better than most policymakers. Like a basic income, for many people it seems too simple to be true; but in a nutshell, that is Keynesian monetary policy. When spending falls and the economy slows down as a result, the government should respond by expanding the money supply so that people start spending again. In practice they usually expand the money supply by a really bizarre roundabout way, buying and selling bonds in open market operations in order to change the interest rate that banks charge each other for loans of reserves, the Fed funds rate, in the hopes that banks will change their actual lending interest rates and more people will be able to borrow, thus, ultimately, increasing the money supply (because, remember, banks don’t have the money they lend you—they create it).

We could actually just print some money and give it to people (or rather, change a bunch of numbers in an IRS database), but this is very unpopular, particularly among people like Ron Paul and other gold-bug Republicans who don’t understand how monetary policy works. So instead we try to obscure the printing of money behind a bizarre chain of activities, opening many more opportunities for failure: Chiefly, we can hit the zero lower bound where interest rates are zero and can’t go any lower (or can they?), or banks can be too stingy and decide not to lend, or people can be too risk-averse and decide not to borrow; and that’s not even to mention the redistribution of wealth that happens when all the money you print is given to banks. When that happens we turn to “unconventional monetary policy”, which basically just means that we get a little bit more honest about the fact that we’re printing money. (Even then you get articles like this one insisting that quantitative easing isn’t really printing money.)

I don’t know, maybe there’s actually some legitimate reason to do it this way—I do have to admit that when governments start openly printing money it often doesn’t end well. But really the question is why you’re printing money, whom you’re giving it to, and above all how much you are printing. Weimar Germany printed money to pay off odious war debts (because it totally makes sense to force a newly-established democratic government to pay the debts incurred by belligerent actions of the monarchy they replaced; surely one must repay one’s debts). Hungary printed money to pay for rebuilding after the devastation of World War 2. Zimbabwe printed money to pay for a war (I’m sensing a pattern here) and compensate for failed land reform policies. In all three cases the amount of money they printed was literally billions of times their original money supply. Yes, billions. They found their inflation cascading out of control and instead of stopping the printing, they printed even more. The United States has so far printed only about three times our original monetary base, still only about a third of our total money supply. (Monetary base is the part that the Federal reserve controls; the rest is created by banks. Typically 90% of our money is not monetary base.) Moreover, we did it for the right reasons—in response to deflation and depression. That is why, as Matthew O’Brien of The Atlantic put it so well, the US can never be Weimar.

I was supposed to be talking about saving and investment; why am I talking about money supply? Because investment is driven by the money supply. It’s not driven by saving, it’s driven by lending.

Now, part of the underlying theory was that lending and saving are supposed to be tied together, with money lent coming out of money saved; this is true if you assume that things are in a nice tidy equilibrium. But we never are, and frankly I’m not sure we’d want to be. In order to reach that equilibrium, we’d either need to have full-reserve banking, or banks would have to otherwise have their lending constrained by insufficient reserves; either way, we’d need to have a constant money supply. Any dollar that could be lent, would have to be lent, and the whole debt market would have to be entirely constrained by the availability of savings. You wouldn’t get denied for a loan because your credit rating is too low; you’d get denied for a loan because the bank would literally not have enough money available to lend you. Banking would have to be perfectly competitive, so if one bank can’t do it, no bank can. Interest rates would have to precisely match the supply and demand of money in the same way that prices are supposed to precisely match the supply and demand of products (and I think we all know how well that works out). This is why it’s such a big problem that most macroeconomic models literally do not include a financial sector. They simply assume that the financial sector is operating at such perfect efficiency that money in equals money out always and everywhere.

So, recognizing that saving and investment are in fact not equal, we now have two separate questions: What is the optimal rate of saving, and what is the optimal rate of investment? For saving, I think the question is almost meaningless; individuals should save according to their future income (since they’re so bad at predicting it, we might want to encourage people to save extra, as in programs like Save More Tomorrow), but the aggregate level of saving isn’t an important question. The important question is the aggregate level of investment, and for that, I think there are two ways of looking at it.

The first way is to go back to that original neoclassical growth model and realize it makes a lot more sense when the s term we called “saving” actually is a funny way of writing “investment”; in that case, perhaps we should indeed invest the same proportion of income as the income that goes to capital. An interesting, if draconian, way to do so would be to actually require this—all and only capital income may be used for business investment. Labor income must be used for other things, and capital income can’t be used for anything else. The days of yachts bought on stock options would be over forever—though so would the days of striking it rich by putting your paycheck into a tech stock. Due to the extreme restrictions on individual freedom, I don’t think we should actually do such a thing; but it’s an interesting thought that might lead to an actual policy worth considering.

But a second way that might actually be better—since even though the model makes more sense this way, it still has a number of serious flaws—is to think about what we might actually do in order to increase or decrease investment, and then consider the costs and benefits of each of those policies. The simplest case to analyze is if the government invests directly—and since the most important investments like infrastructure, education, and basic research are usually done this way, it’s definitely a useful example. How is the government going to fund this investment in, say, a nuclear fusion project? They have four basic ways: Cut spending somewhere else, raise taxes, print money, or issue debt. If you cut spending, the question is whether the spending you cut is more or less important than the investment you’re making. If you raise taxes, the question is whether the harm done by the tax (which is generally of two flavors; first there’s the direct effect of taking someone’s money so they can’t use it now, and second there’s the distortions created in the market that may make it less efficient) is outweighed by the new project. If you print money or issue debt, it’s a subtler question, since you are no longer pulling from any individual person or project but rather from the economy as a whole. Actually, if your economy has unused capacity as in a depression, you aren’t pulling from anywhere—you’re simply adding new value basically from thin air, which is why deficit spending in depressions is such a good idea. (More precisely, you’re putting resources to use that were otherwise going to lay fallow—to go back to my earlier example, the tennis shoes will no longer rest on the shelves.) But if you do not have sufficient unused capacity, you will get crowding-out; new debt will raise interest rates and make other investments more expensive, while printing money will cause inflation and make everything more expensive. So you need to weigh that cost against the benefit of your new investment and decide whether it’s worth it.

This second way is of course a lot more complicated, a lot messier, a lot more controversial. It would be a lot easier if we could just say: “The target investment rate should be 33% of GDP.” But even then the question would remain as to which investments to fund, and which consumption to pull from. The abstraction of simply dividing the economy into “consumption” versus “investment” leaves out matters of the utmost importance; Paul Allen’s 400-foot yacht and food stamps for children are both “consumption”, but taxing the former to pay for the latter seems not only justified but outright obligatory. The Bridge to Nowhere and the Humane Genome Project are both “investment”, but I think we all know which one had a higher return for human society. The neoclassical model basically assumes that the optimal choices for consumption and investment are decided automatically (automagically?) by the inscrutable churnings of the free market, but clearly that simply isn’t true.

In fact, it’s not always clear what exactly constitutes “consumption” versus “investment”, and the particulars of answering that question may distract us from answering the questions that actually matter. Is a refrigerator investment because it’s a machine you buy that sticks around and does useful things for you? Or is it consumption because consumers buy it and you use it for food? Is a car an investment because it’s vital to getting a job? Or is it consumption because you enjoy driving it? Someone could probably argue that the appreciation on Paul Allen’s yacht makes it an investment, for instance. Feeding children really is an investment, in their so-called “human capital” that will make them more productive for the rest of their lives. Part of the money that went to the Humane Genome Project surely paid some graduate student who then spent part of his paycheck on a keg of beer, which would make it consumption. And so on. The important question really isn’t “is this consumption or investment?” but “Is this worth doing?” And thus, the best answer to the question, “How much should we save?” may be: “Who cares?”