Jun 22 JDN 2460849
Things look pretty bleak right now. Wildfires rage across Canada, polluting the air across North America. Russia is still at war with Ukraine, and Israel seems to be trying to start a war with Iran. ICE continues sending agents without badges to kidnap people in unmarked vehicles and sending them to undisclosed locations. Climate change is getting worse, and US policy is pivoting from subsidizing renewables back to subsidizing fossil fuels. And Trump, now revealed to be a literal fascist, is still President.
But things can get better.
I can’t guarantee that they will, nor can I say when; but there is still hope that a better future is possible.
It has been very difficult to assemble a strong coalition against the increasingly extreme far-right in this country (epitomized by Trump). This seems odd, when most Americans hold relatively centrist views. Yes, more Americans identify as conservative than as liberal, but Trump isn’t a conservative; he’s a radical far-right fascist. Trump recently gave a speech endorsing ethnic cleansing, for goodness’ sake! I’m liberal, but I’d definitely vote for a conservative like Mitt Romney rather than a Stalinist! So why are “conservatives” voting for a fascist?
But setting aside the question of why people voted for Trump, we still have the question of why the left has not been able to assemble a strong coalition against him.
I think part of the problem is that the left really has two coalitions within it: The center left, who were relatively happy with the status quo before Trump and want to go back to that; and the far left, who were utterly unhappy with that status quo and want radical change. So while we all agree that Trump is awful, we don’t really agree on what he’s supposed to be replaced with.
It’s of course possible to be in between, and indeed I would say that I am. While clearly things were better under Obama and Biden than they have been under Trump, there were still a lot of major problems in this country that should have been priorities for national policy but weren’t:
- Above all, climate change—the Democrats at least try to do something against it, but not nearly enough. Our carbon emissions are declining, but it’s very unclear if we’ll actually hit our targets. The way we have been going, we’re in for a lot more hurricanes and wildfires and droughts.
- Housing affordability is still an absolute crisis; half of renters spend more than the targeted 30% of their income on housing, and a fourth spend more than 50%.Homelessness is now at a record high.
- Healthcare is still far too expensive in this country; we continue to spend far more than other First World countries without getting meaningfully better care.
- While rights and protections for LGB people have substantially improved in the last 30 years, rights and protections for trans people continue to lag behind.
- Racial segregation in housing remains the de facto norm, even though it is de jure illegal.
- Livestock remain exempted from the Animal Welfare Act and in 2002 laboratory rats and mice were excluded as well, meaning that cruel or negligent treatment which would be illegal for cats and dogs is still allowed on livestock and lab rats.
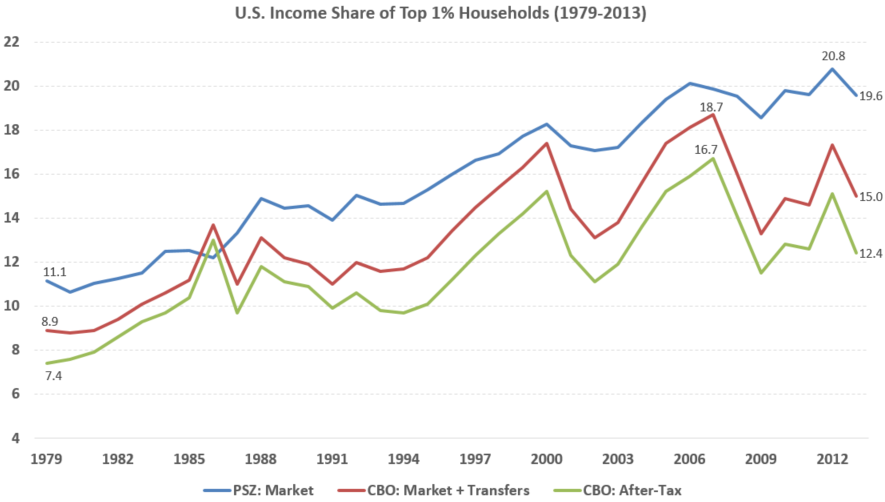
- Income and wealth inequality in this country remains staggeringly high, and the super-rich continue to gain wealth at a terrifying rate.
- Our voting system is terrible—literally the worst possible system that can technically still be considered democracy.
This list is by no means exhaustive, but these are the issues that seem most salient to me.
2 and 3 both clearly showed up in my Index of Necessary Expenditure; these costs were the primary reason why raising a family of 4 was unaffordable on a median household income.
So it isn’t right to say that I was completely happy with how things were going before. But I still think of myself as center left, because I don’t believe we need to tear everything down and start over.
I have relatively simple recommendations that would go a long way toward solving all 8 of these problems:
Climate change could be greatly mitigated if we’d just tax carbon already, or implement a cap-and-trade system like California’s nationwide. If that’s too politically unpalatable, subsidize nuclear power, fusion research, and renewables instead. That’s way worse from a budget perspective, but for some reason Americans are just fanatically opposed to higher gas prices.
Housing affordability is politically thorny, but economically quite simple: Build more housing. Whatever we have to do to make that happen, we should do it. Maybe this involves changes to zoning or other regulations. Maybe it involves subsidies to developers. Maybe it involves deploying eminent domain to build public housing. Maybe it involves using government funds to build housing and then offering it for sale on the market. But whatever we do, we need more housing.
Healthcare costs are a trickier one; Obamacare helped, but wasn’t enough. I think what I would like to see next is an option to buy into Medicare; before you are old enough to get it for free, you can pay a premium to be covered by it. Because Medicare is much more efficient than private insurance, you could pay a lower premium and get better coverage, so a lot of people would likely switch (which is of course exactly why insurance companies would fight the policy at every turn). Even putting everyone on Medicare might not be enough; to really bring costs down, we may need to seriously address the fact that US doctors, particularly specialists, are just radically higher-paid than any other doctors in the world. Is an American doctor who gets $269,000 per year really 88% better than a French doctor who gets $143,000?
The policies we need for LGBT rights are mostly no-brainers.
Okay, I can admit to some reasonable nuance when it comes to trans women in pro sports (the statistical advantages they have over cis women are not as clear-cut as many people think, but they do seem to exist; average athletic performance for trans women seems to be somewhere in between the average for cis men and the average for cis women), but that’s really not a very important issue. Like, seriously, why do we care so much about pro sports? Either let people play sports according to their self-identified gender, or make the two options “cis women” and “other” and let trans people play the latter. And you can do the same thing with school sports, or you can eliminate them entirely because they are a stupid waste of academic resources; but either way this should not be considered a top priority policy question. (If parents want their kids to play sports, they can form their own leagues; the school shouldn’t be paying for it. Winning games is not one of the goals of an academic institution. If you want kids to get more exercise, give them more recess and reform the physical education system so it isn’t so miserable for the kids who need it most.)
But there is absolutely no reason not to let people use whatever pronouns and bathrooms they want; indeed, there doesn’t really seem to be a compelling reason to gender-segregate bathrooms in the first place, and removing that segregation would most benefit women, who often have to wait much longer in line for the bathroom. (The argument that this somehow protects women never made sense to me; if a man wants to assault women in the bathroom, what’s to stop him from just going into the women’s bathroom? It’s not like there’s a magic field that prevents men from entering. He’s already planning on committing a crime, so it doesn’t seem like he’s very liable to held back by social norms. It’s worthwhile to try to find ways to prevent sexual assault, but segregating bathrooms does little or nothing toward that goal—and indeed, trans-inclusive bathrooms do not statistically correlate with higher rates of sexual assault.) But okay, fine, if you insist on having the segregation, at least require gender-neutral bathrooms as well. This is really not that difficult; it’s pretty clearly bigotry driving this, not serious policy concerns.
Not exempting any vertebrate animals from anti-cruelty legislation is an incredibly simple thing to do, obviously morally better, and the only reason we’re not doing it is that it would hurt agribusinesses and make meat more expensive. There is literally zero question what the morally right thing to do here is; the question is only how to get people to actually do that morally right thing.
Finally, how do we fix income inequality? Some people—including some economists—treat this as a very complicated, difficult question, but I don’t think it is. I think the really simple, obvious answer is actually the correct one: Tax rich people more, and use the proceeds to help poor people. We should be taxing the rich a lot more; I want something like the revenue-maximizing rate, estimated at about 70%. (And an even higher rate like the 90% we had in the 1950s is not out of the question.) These funds could either provide services like education and healthcare, or they could simply be direct cash transfers. But one way or another, the simplest, most effective way to reduce inequality is to tax the rich and help the poor. A lot of economists fear that this would hurt the overall economy, but particularly if these rates are really targeted at the super-rich (the top 0.01%), I don’t see how they could, because all those billions of dollars are very clearly monopoly rents rather than genuine productivity. If anything, making it harder to amass monopoly rents should make the economy more efficient. And taking say 90% of the roughly 10% return just the top 400 billionaires make on their staggering wealth would give us an additional $480 billion per year.
Fixing our voting system is also quite straightforward. Ranked-choice voting would be a huge improvement, and has already been implemented successfully in several states. Even better would be range voting, but so far very few places have been bold enough to actually try it. But even ranked-choice voting would remove most of the terrible incentives that plurality voting creates, and likely allow us to move beyond the two-party system into a much more representative multiparty system.
None of this requires overthrowing the entire system or dismantling capitalism.
That is, we can have a positive vision of the future that doesn’t require revolution or radical change.
Unfortunately, there’s still a very good chance we’ll do none of it.