A lot of economists seem puzzled by the fact that co-ops are just as efficient as corporate firms, since they have this idea that profit-sharing inevitably results in lower efficiency due to perverse incentives.
I think they’ve been modeling co-ops wrong. Here I present a new model, a very simple one, with linear supply and demand curves. Of course one could make a more sophisticated model, but this should be enough to make the point (and this is just a blog post, not a research paper, after all).
Demand curve is p = a – b q
Marginal cost is f q
There are n workers, who would hold equal shares of the co-op.
Competitive market
First, let’s start with the traditional corporate firm in a competitive market.
Since the market is competitive, price would equal marginal cost would equal wage:
a – b q = d q
q = a/(b+f)
w = d (a/(b+f)) = (a d)/(b+f)
Total profit will be
(p – w)q = 0.
Monopoly firm
In a monopoly, marginal revenue would equal marginal cost: d[pq]/dq = a – 2 b q
If they are also a monopsonist in the labor market, this marginal cost would be marginal cost of labor, not wage:
d[d q2]/dq = 2 f q
a – 2 b q = 2 f q
q = a/(2b + 2f)
p = a – b q = a (1 – b/(2b + 2f)) = (a (b + 2f))/(2b + 2f)
First, suppose that instead of working for a wage, I work for profit sharing.
If our product market is competitive, we’ll be price-takers, and we will produce until price equals marginal cost:
p = f q
a – b q = f q
q = a/(a+b)
But will we, really? I only get 1/n share of the profits. So let’s see here. My marginal cost of production is still f q, but the marginal benefit I get from more sales may only be p/n.
In that case I would work until:
p/n = f q
(a – b q)/n = fq
a – b q = n f q
q = (a/(b+nf))
Thus I would under-produce. This is the usual argument against co-ops and similar shared ownership.
Co-ops with wages
But that’s not actually how co-ops work. They pay wages. Why do they do that? Well, consider what happens if I am offered a wage as a worker-owner of the co-op.
Is there any reason for the co-op to vote on a wage that is less than the competitive market? No, because owners are workers, so any additional profit from a lower wage would simply be taken from their own wages.
If there any reason for the co-op to vote on a wage that is more than the competitive market? No, because workers are owners, and any surplus lost by paying higher wages would simply be taken from their own profits.
So if the product market is competitive, the co-op will produce the same amount and charge the same price as a firm in perfect competition, even if they have market power over their own wages.
Monopoly co-ops
The argument above doesn’t assume that the co-op has no market power in the labor market. Thus if they are a monopoly in the product market and a monopsony in the labor market, they still pay a competitive wage.
Thus they would set marginal revenue equal to marginal cost:
a – 2 b q = f q
q = a/(2b + f)
The co-op will produce more than the monopoly firm..
This is the new price:
p = a – b q = a(1 – b/(2b+f)) = a(b+f)/(2b + f)
It’s not obvious that this is lower than the price charged by the monopoly firm, but it is.
(a (b + 2f))/(2b + 2f) – a(b+f)/(2b + f) = (a (2b + f)(b + 2f) – 2 a(b+f)2)/(2(b+f)(2b+f))
This is proportional to:
(2b + f)(b + 2f) – 2(b+f)2
2b2 + 5bf + 2f2 – (2b2 + 4bf + 2f2) = bf
So it’s not a large difference, but it’s there. In the presence of market power in the labor market, the co-op is better for consumers, because they get more goods and pay a lower price.
Thus, there is actually no lost efficiency from being a co-op. There is simply much lower inequality, and potentially higher efficiency.
Since they’re just as efficient—if not more so—and produce much lower inequality, switching more firms over to co-ops would clearly be a good thing.
Why, then, aren’t co-ops more common?
Because the people who have the money don’t like them.
The biggest barrier facing co-ops is their inability to get financing, because they don’t pay shareholders (so no IPOs) and banks don’t like to lend to them. They tend to make less profit than corporate firms, which offers investors a lower return—instead that money goes to the worker-owners. This lower return isn’t due to inefficiency; it’s just a different distribution of income, more to labor and less to capital.
We will need new financial institutions to support co-ops, such as the Cooperative Fund of New England. And general redistribution of wealth would also help, because if middle class people had more wealth they could afford to finance co-ops. (It would also be good for many other reasons, of course.)
In last week’s post I constructed an Index of National Expenditure (INE), attempting to estimate the total cost of all of the things a family needs and can’t do without, like housing, food, clothing, cars, healthcare, and education. What I found shocked me: The median family cannot afford all necessary expenditures.
I have a couple more thoughts about that.
I still don’t understand why people care so much about gas prices.
Gasoline was a relatively small contribution to INE. It was more than clothing but less than utilities, and absolutely dwarfed by housing, food, or college. I thought maybe since I only counted a 15-mile commute, maybe I didn’t actually include enoughgasoline usage, but based on this estimate of about $2000 per driver, I was in about the right range; my estimate for the same year was $3350 for a 2-car family.
I think I still have to go with my salience hypothesis: Gasoline is the only price that we plaster in real-time on signs on the side of the road. So people are constantly aware of it, even though it isn’t actually that important.
The price surge that should be upsetting people is housing.
If the price of homes had only risen with the rate of CPI inflation instead of what it actually did, the median home price in 2024 would be only $234,000 instead of the $396,000 it actually is; and by my estimation that would save a typical family $11,000 per year—a whopping 15% of their income, and nearly enough to make the INE affordable by itself.
Now, I’ll consider some possible objections to my findings.
Objection 1: A typical family doesn’t actually spend this much on these things.
You’re right, they don’t! Because they couldn’t possibly. Even with substantial debt, you just can’t sustainably spend 125% of your after-tax household income.
My goal here was not to estimate how much families actually spend; it was to estimate how much they need to spend in order to live a good life and not feel deprived.
What I have found is that most American families feel deprived. They are forced to sacrifice something really important—like healthcare, or education, or owning a home—because they simply can’t afford it.
What I’m trying to do here is find the price of the American Dream; and what I’ve found is that the American Dream has a price that most Americans cannot afford.
Objection 2: You should use median healthcare spending, not mean.
I did in fact use mean figures instead of median for healthcare expenditures, mainly because only the mean was readily available. Mean income is higher than median income, so you might say that I’ve overestimated healthcare expenditure—and in a sense that’s definitely true. The median family spends less than this on healthcare.
But the reason that the median family spends less than this on healthcare is not that they want to, but that they have to. Healthcare isn’t a luxury that people buy more of because they are richer. People buy either as much as they need or as much as they can afford—whichever is lower, which is typically the latter. Using the mean instead of the median is a crude way to account for that, but I think it’s a defensible one.
But okay, let’s go ahead and cut the estimate of healthcare spending in half; even if you do that, the INE is still larger than after-tax median household income in most years.
Objection 3: A typical family isn’t a family of four, it’s a family of three.
Part of what I seem to be finding here is that a family of four is unaffordable—literally impossible to afford—on a typical family income.
But a healthy society is one in which typical families have two or three children. That is what we need in order to achieve population replacement. When families get smaller than that, we aren’t having enough children, and our population will decline—which means that we’ll have too many old people relative to young people. This puts enormous pressure on healthcare and pension systems, which rely upon the fact that young people produce more, in order to pay for the fact that old people cost more.
This is bad. This is not sustainable. If the reason families aren’t having enough kids is that they can’t afford them—and this fits with other research on the subject—then this economic failure damages our entire society, and it needs to be fixed.
Objection 4: Many families buy their cars used.
Perhaps 1/10 of a new car every year isn’t an ideal estimate of how much people spend on their cars, but if anything I think it’s conservative, because if you only buy a car every 10 years, and it was already used when you bought it, you’re going to need to spend a lot on maintaining it—quite possibly more than it would cost to get a new one. Motley Fool actually estimates the ownership cost of just one car at substantially more than I estimated for two cars. So if anything your complaint should be that I’ve underestimated the cost by not adequately including maintenance and insurance.
Objection 5: Not everyone gets a four-year college degree.
Fair enough; a substantial proportion get associate’s degrees, and most people get no college degree at all. But some also get graduate degrees, which is even more expensive (ask me how I know).
Moreover, in today’s labor market, having a college degree makes a huge difference in your future earnings; a bachelor’s degree increases your lifetime earnings by a whopping 84%. In theory it’s okay to have a society where most people don’t go to college; in practice, in our society, not going to college puts you at a tremendous disadvantage for the rest of your life. So we either need to find a way to bring wages up for those who don’t go to college, or find a way to bring the cost of college down.
This is probably one of the things that families actually choose to scrimp on, only sending one kid to college or none at all. But because college is such a huge determinant of earnings, this perpetuates intergenerational inequality: Only rich families can afford to send their kids to college, and only kids who went to college grow up to have rich families.
Objection 6: You don’t actually need to save for college; you can use student loans.
Yes, you can, and in practice, most people who to college do. But while this solves the liquidity problem (having enough money right now), it does not solve the solvency problem (having enough money in the long run). Failing to save for college and relying on student loans just means pushing the cost of college onto your children—and since we’ve been doing that for over a generation, feel free to replace the category “college savings” with “repaying student loans”; it won’t meaningfully change the results.
I’m still reeling from the fact that Donald Trump was re-elected President. He seemed obviously horrible at the time, and he still seems horrible now, for many of the same reasons as before (we all knew the tariffs were coming, and I think deep down we knew he would sell out Ukraine because he loves Putin), as well as some brand new ones (I did not predict DOGE would gain access to all the government payment systems, nor that Trump would want to start a “crypto fund”). Kamala Harris was not an ideal candidate, but she was a good candidate, and the comparison between the two could not have been starker.
Now that the dust has cleared and we have good data on voting patterns, I am now less convinced than I was that racism and sexism were decisive against Harris. I think they probably hurt her some, but given that she actually lost the most ground among men of color, racism seems like it really couldn’t have been a big factor. Sexism seems more likely to be a significant factor, but the fact that Harris greatly underperformed Hillary Clinton among Latina women at least complicates that view.
A lot of voters insisted that they voted on “inflation” or “the economy”. Setting aside for a moment how absurd it was—even at the time—to think that Trump (he of the tariffs and mass deportations!) was going to do anything beneficial for the economy, I would like to better understand how people could be so insistent that the economy was bad even though standard statistical measures said it was doing fine.
Krugman believes it was a “vibecession”, where people thought the economy was bad even though it wasn’t. I think there may be some truth to this.
But today I’d like to evaluate another possibility, that what people were really reacting against was not inflation per se but necessitization.
I first wrote about necessitization in 2020; as far as I know, the term is my own coinage. The basic notion is that while prices overall may not have risen all that much, prices of necessities have risen much faster, and the result is that people feel squeezed by the economy even as CPI growth remains low.
In this post I’d like to more directly evaluate that notion, by constructing an index of necessary expenditure (INE).
The core idea here is this:
What would you continue to buy, in roughly the same amounts, even if it doubled in price, because you simply can’t do without it?
For example, this is clearly true of housing: You can rent or you can own, but can’t not have a house. And nor are most families going to buy multiple houses—and they can’t buy partial houses.
It’s also true of healthcare: You need whatever healthcare you need. Yes, depending on your conditions, you maybe could go without, but not without suffering, potentially greatly. Nor are you going to go out and buy a bunch of extra healthcare just because it’s cheap. You need what you need.
I think it’s largely true of education as well: You want your kids to go to college. If college gets more expensive, you might—of necessity—send them to a worse school or not allow them to complete their degree, but this would feel like a great hardship for your family. And in today’s economy you can’t not send your kids to college.
But this is not true of technology: While there is a case to be made that in today’s society you need a laptop in the house, the fact is that people didn’t used to have those not that long ago, and if they suddenly got a lot cheaper you very well might buy another one.
Well, it just so happens that housing, healthcare, and education have all gotten radically more expensive over time, while technology has gotten radically cheaper. So prima facie, this is looking pretty plausible.
But I wanted to get more precise about it. So here is the index I have constructed. I consider a family of four, two adults, two kids, making the median household income.
To get the median income, I’ll use this FRED series for median household income, then use this table of median federal tax burden to get an after-tax wage. (State taxes vary too much for me to usefully include them.) Since the tax table ends in 2020 which was anomalous, I’m going to extrapolate that 2021-2024 should be about the same as 2019.
I assume the kids go to public school, but the parents are saving up for college; to make the math simple, I’ll assume the family is saving enough for each kid to graduate from with a four-year degree from a public university, and that saving is spread over 16 years of the child’s life. 2*4/16 = 0.5; this means that each year the family needs to come up with 0.5 years of cost of attendance. (I had to get the last few years from here, but the numbers are comparable.)
I assume the family owns two cars—both working full time, they kinda have to—which I amortize over 10 year lifetimes; 2*1/10 = 0.2, so each year the family pays 0.2 times the value of an average midsize car. (The current average new car price is $33226; I then use the CPI for cars to figure out what it was in previous years.)
I assume they pay a 30-year mortgage on the median home; they would pay interest on this mortgage, so I need to factor that in. I’ll assume they pay the average mortgage rate in that year, but I don’t want to have to do a full mortgage calculation (including PMI, points, down payment etc.) for each year, so I’ll say that they amount they pay is (1/30 + 0.5 (interest rate))*(home value) per year, which seems to be a reasonable approximation over the relevant range.
I assume that both adults have a 15-mile commute (this seems roughly commensurate with the current mean commute time of 26 minutes), both adults work 5 days per week, 50 weeks per year, and their cars get the median level of gas mileage. This means that they consume 2*15*2*5*50/(median MPG) = 15000/(median MPG) gallons of gasoline per year. I’ll use this BTS data for gas mileage. I’m intentionally not using median gasoline consumption, because when gas is cheap, people might take more road trips, which is consumption that could be avoided without great hardship when gas gets expensive. I will also assume that the kids take the bus to school, so that doesn’t contribute to the gasoline cost.
That I will multiply by the average price of gasoline in June of that year, which I have from the EIA since 1993. (I’ll extrapolate 1990-1992 as the same as 1993, which is conservative.)
I will assume that the family owns 2 cell phones, 1 computer, and 1 television. This is tricky, because the quality of these tech items has dramatically increased over time.
If you try to measure with equivalent buying power (e.g. a 1 MHz computer, a 20-inch CRT TV), then you’ll find that these items have gotten radically cheaper; $1000 in 1950 would only buy as much TV as $7 today, and a $50 Raspberry Pi‘s 2.4 GHz processor is 150 times faster than the 16 MHz offered by an Apple Powerbook in 1991—despite the latter selling for $2500 nominally. So in dollars per gigahertz, the price of computers has fallen by an astonishing 7,500 times just since 1990.
But I think that’s an unrealistic comparison. The standards for what was considered necessary have also increased over time. I actually think it’s quite fair to assume that people have spent a roughly constant nominal amount on these items: about $500 for a TV, $1000 for a computer, and $500 for a cell phone. I’ll also assume that the TV and phones are good for 5 years while the computer is good for 2 years, which makes the total annual expenditure for 2 phones, a TV, and a computer equal to 2/5*500 + 1/5*500 + 1/2*1000 = 800. This is about what a family must spend every year to feel like they have an adequate amount of digital technology.
I will assume that the family buys the equivalent of five months of infant care per year; they surely spend more than this (in either time or money) when they have actual infants, but less as the kids grow. This amounts to about $5000 today, but was only $1600 in 1990—a 214% increase, or 3.42% per year.
For food expenditure, I’m going to use the USDA’s thrifty plan for June of that year. I’ll use the figures assuming that one child is 6 and the other is 9. I don’t have data before 1994, so I’ll extrapolate that with the average growth rate of 3.2%.
The figures I had the hardest time getting were for utilities. It’s also difficult to know what to include: Is Internet access a necessity? Probably, nowadays—but not in 1990. Should I separate electric and natural gas, even though they are partial substitutes? But using these figures I estimate that utility costs rise at about 0.8% per year in CPI-adjusted terms, so what I’ll do is benchmark to $3800 in 2016 and assume that utility costs have risen by (0.8% + inflation rate) per year each year.
Healthcare is also a tough one; pardon the heteronormativity, but for simplicity I’m going to use the mean personal healthcare expenditures for one man and woman (aged 19-44) and one boy and one girl (aged 0-18). Unfortunately I was only able to find that for two-year intervals in the range from 2002 to 2020, so I interpolated and extrapolated both directions assuming the same average growth rate of 3.5%.
So let’s summarize what all is included here:
Estimated payment on a mortgage
0.5 years of college tuition
amortized cost of 2 cars
7500/(median MPG) gallons of gasoline
amortized cost of 2 phones, 1 computer, and 1 television
average spending on clothes
11% of income on food
Estimated utilities spending
Estimated childcare equivalent to five months of infant care
Healthcare for one man, one woman, one boy, one girl
There are obviously many criticisms you could make of these choices. If I were writing a proper paper, I would search harder for better data and run robustness checks over the various estimation and extrapolation assumptions. But for these purposes I really just want a ballpark figure, something that will give me a sense of what rising cost of living feels like to most people.
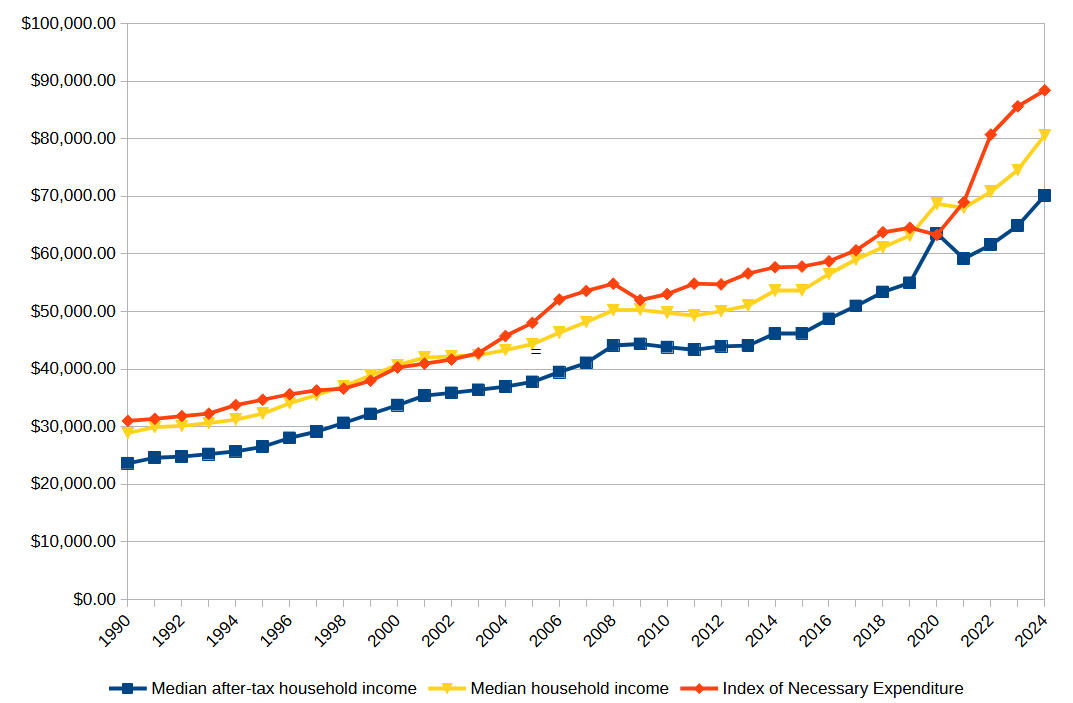
What I found absolutely floored me. Over the range from 1990 to 2024:
The Index of Necessary Expenditure rose by an average of 3.45% per year, almost a full percentage point higher than the average CPI inflation of 2.62% per year.
Over the same period, after-tax income rose at a rate of 3.31%, faster than CPI inflation, but slightly slower than the growth rate of INE.
The Index of Necessary Expenditure was over 100% of median after-tax household income every year except 2020.
Since 2021, the Index of Necessary Expenditure has risen at an average rate of 5.74%, compared to CPI inflation of only 2.66%. In that same time, after-tax income has only grown at a rate of 4.94%.
Point 3 is the one that really stunned me. The only time in the last 34 years that a family of four has been able to actually pay for all necessities—just necessities—on a typical household income was during the COVID pandemic, and that in turn was only because the federal tax burden had been radically reduced in response to the crisis. This means that every single year, a typical American family has been either going further and further into debt, or scrimping on something really important—like healthcare or education.
No wonder people feel like the economy is failing them! It is!
In fact, I can even make sense now of how Trump could convince people with “Are you better off than you were four years ago?” in 2024 looking back at 2020—while the pandemic was horrific and the disruption to the economy was massive, thanks to the US government finally actually being generous to its citizens for once, people could just about actually make ends meet. That one year. In my entire life.
This is why people felt betrayed by Biden’s economy. For the first time most of us could remember, we actually had this brief moment when we could pay for everything we needed and still have money left over. And then, when things went back to “normal”, it was taken away from us. We were back to no longer making ends meet.
When I went into this, I expected to see that the INE had risen faster than both inflation and income, which was indeed the case. But I expected to find that INE was a large but manageable proportion of household income—maybe 70% or 80%—and slowly growing. Instead, I found that INE was greater than 100% of income in every year but one.
And the truth is, I’m not sure I’ve adequately covered all necessary spending! My figures for childcare and utilities are the most uncertain; those could easily go up or down by quite a bit. But even if I exclude them completely, the reduced INE is still greater than income in most years.
Suddenly the way people feel about the economy makes a lot more sense to me.
In a previous post, I defended the existence of compatibilism and free will. There are a few subtler issues with free will that I’d now like to deal with in this week’s post.
The ability to do otherwise
One subtler problem for free will comes from the idea of doing otherwise—what some philosophers call “genuinely open alternatives”. The question is simple to ask, but surprisingly difficult to answer: “When I make a choice, could I have chosen otherwise?”
On one hand, the answer seems obviously “yes” because, when I make a choice, I consider a set of alternatives and select the one that seems best. If I’d wanted to, I’d have chosen something else. On the other hand, the answer seems obviously “no”, because the laws of nature compelled my body and brain to move in exactly the way that it did. So which answer is right?
I think the key lies in understanding specifically how the laws of nature cause my behavior. It’s not as if my arms are on puppet strings, and no matter what I do, they will be moved in a particular way; if I choose to do something, I will do it; if I choose not to, I won’t do it. The laws of nature constrain my behavior by constraining my desires; they don’t constrain what I do in spite of what I want—instead, they constrain what I do through what I want. I am still free to do what I choose to do.
So, while my actions may be predetermined, they are determined by who I am, what I want, what experiences I have. These are precisely the right kind of determinants for free will to make sense; my actions spring not from random chance or external forces, but instead from my own character.
If we really mean to ask, “Could I (exactly as I was, in the situation I was in) have done otherwise (as free choice, not random chance)?” the answer is “No”. Something would have to be different. But one of the things that could be different is me! If I’d had different genes, or a different upbringing, or exposure to different ideas during my life, I might have acted differently. Most importantly, if I had wanted a different outcome, I could have chosen it. So if all we mean by the question is “Could I (if I wanted to) have done otherwise?” the answer is a resounding “Yes”. What I have done in my life speaks to my character—who I am, what I want. It doesn’t merely involve luck (though it may involve some luck), and it isn’t reducible to factors external to me. I am part of the causal structure of the universe; my will is a force. Though the world is made of pushes and pulls, I am among the things pushing and pulling.
As Daniel Dennett pointed out, this kind of freedom admits of degrees: It is entirely possible for a deterministic agent to be more or less effective at altering its circumstances to suit its goals. In fact, we have more options today than we did a few short centuries ago, and this means that in a very real sense we have more free will.
Empirically observing free will
What is really at stake, when we ask whether a person has free will? It seems to me that the question we really want to answer is this: “Are we morally justified in rewarding or punishing this person?” If you were to conclude, “No, they do not have free will, but we are justified in punishing them.”, I would think that you meant something different than I do by “free will”. If instead your ruling was “Yes, they have free will, but we may not reward or punish them.”, I would be similarly confused. Moreover, the concern that without free will, our moral and legal discourse collapses, seems to be founded upon this general notion—that reward and punishment, crucial to ethics and law (not to mention economics!) as they are, are dependent upon free will.
Yet, consider this as a scientific question. What kind of organism can respond to reward and punishment? What sort of thing will change its behavior based upon rewards, punishments, and the prospect thereof? Certainly you must agree that there is no point punishing a thing that will not be affected by the punishment in any way—banging your fist on the rocks will not make the rocks less likely to crush your loved ones. Conversely, I think you’d be hard-pressed to say it’s pointless to punish if the punishment would result in some useful effect. Maybe it’s not morally relevant—but then, why not? If you can make the world better by some action, doesn’t that, other things equal, give you a moral reason to perform that action?
We know exactly what sort of thing responds to reward and punishment: Animals. Specifically, animals that are operant-conditionable, for operant conditioning consists precisely in the orchestrated use of reward and punishment. Humans are of course supremely operant-conditionable; indeed, we can be trained to do incredibly complex things—like play a piano, pilot a space shuttle, hit a fastball, or write a book—and, even more impressively, we can learn to train ourselves to do such things. In fact, clearly something more than operant conditioning is at work here, because certain human behaviors (like language) are far too complex to learn by simple reward and punishment. There is a lot of innate cognition going on in the human brain—but over that layer of innate cognition we can add a virtually endless range of possible learned behaviors.
That is to say, learning—the capacity to change future behavior based upon past experience—is precisely in alignment with our common intuitions about free will—that humans have the most, animals have somewhat less, computers might have some, and rocks have none. Yes, there are staunch anthropocentrist dualists who would insist that animals and computers have no “free will”. But if you ask someone, “Did that dog dig that hole on purpose?” their immediate response will not include such theological considerations; it will attribute free choice to Canis lupus familiaris. Indeed, I think if you ask, “Did the chess program make that move on purpose?” the natural answer attributes some sort of will even to the machine. (Maybe just its programmer? I’m not so sure.)
Yet, if the capacity to respond to reward and punishment is all we need to justify reward and punishment, then the problem of free will collapses. We should punish criminals if, and only if, punishing them will reform them to better behavior, or set an example to deter others from similar crimes. Did we lose some deep sense of moral desert and retribution? Maybe, but I think we can probably work it back in, and if we can’t, we can probably do without it. Either way, we can still have a justice system and moral discourse.
Indeed, we can do better than that; we can now determine empirically whether a given entity is a moral agent. The insane psychopathic serial killer who utterly fails to understand empathy may indeed fail to qualify, in which case we should kill them and be done with it, the same way we would kill a virus or destroy an oncoming asteroid. Or they may turn out to qualify, in which case we should punish them as we would other moral agents. The point is, this is a decidable question, at least in principle; all we need are a few behavioral and psychological experiments to determine the answer.
The power of circumstances
There is another problem with classical accounts of free will, which comes from the results of psychology experiments. Perhaps the most seminal was the (in)famous experiment by Stanley Milgram, in which verbal commands caused ordinary people to administer what they thought were agonizing and life-threatening shocks to innocent people for no good reason. Simply by being put in particular circumstances, people found themselves compelled to engage in actions they would never have done otherwise. This experiment was replicated in 2009 under more rigorous controls, with virtually identical results.
This shows that free will is much more complicated than we previously imagined. Even if we acknowledge that human beings are capable of making rational, volitional decisions that reflect their character, we must be careful not to presume that everything people do is based upon character. As Hannah Arendt has pointed out, even the Nazis, though they perpetrated almost unimaginable evils, nonetheless were for the most part biologically and psychologically normal human beings. Perhaps Hitler and Himmler were maniacal psychopaths (and more recently Arendt’s specific example of Eichmann has also been challenged.), but the vast majority of foot soldiers of the German Army who burned villages or gassed children were completely ordinary men in extraordinarily terrible circumstances. This forces us to reflect upon the dire fact that in their place, most of us would have done exactly the same things.
This doesn’t undermine free will entirely, but it does force us to reconsider many of our preconceptions about it. Court systems around the world are based around the presumption that criminal acts are committed by people who are defective in character, making them deserving of punishment; in some cases this is probably right (e.g. Jeffrey Dahmer, Charles Manson), but in many cases, it is clearly wrong. Crime is much more prevalent in impoverished areas; why? Not because poor people are inherently more criminal, but because poverty itself makes people more likely to commit crimes. In a longitudinal study in Georgia, socioeconomic factors strongly predicted crime, especially property crime. An experiment at MIT suggests that letting people move to wealthier neighborhoods actually makes their children less likely to commit crimes. A 2007 report from the Government Accountability Office explicitly endorsed the hypothesis that poverty causes crime.
Really, all of this makes perfect sense: Poor people are precisely those who have the least to lose and the most to gain by breaking the rules. If you are starving, theft may literally save your life. Even if you’re not at the verge of starvation, the poorer you are, the worse your life prospects are, and the more unfairly the system has treated you. Most people who are rich today inherited much of their wealth from ancestors who violently stole it from other people. Why should anyone respect the rules of a system that robbed their ancestors and leaves them forsaken? Compound this with the fact that it is harder to be law-abiding when you are surrounded by thieves, and the high crime rates of inner cities hardly seem surprising.
Does this mean we should abandon criminal justice? Clearly not, for the consequences of doing so would be predictably horrendous. Temporary collapses in civil government typically lead to violent anarchy; this continued for several years in Somalia, and has happened more briefly even in Louisiana (it was not as terrible as the media initially reported, but it was still quite bad.) We do need to hold people responsible for their crimes. But what this sort of research shows is that we also need to consider situational factors when we set policy. The United States has the highest after-tax absolute poverty rate and the highest share of income claimed by the top 0.01\% of any First World nation—an astonishing 4%, meaning that the top 30,000 richest Americans have on average 400 times as much income as the average person. (My master’s thesis was actually on the subject of how this high level of inequality is related to increased corruption.) We also have the third-highest rate of murder in the OECD, after Mexico (by far the highest) and Estonia. Our homicide rate is almost three times that of Canada and over four times that of England. Even worse, the US has the highest incarceration rate in the world. Yes, that’s right; we in the US imprison a larger portion of our population than any other nation on Earth—including Iran, China, and Saudi Arabia.
Social science suggests this is no coincidence; it is our economic inequality that leads to our crime and incarceration. Nor is our poverty a result of insufficient wealth. By the standard measure Gross Domestic Product (GDP), an estimate of the total economic output a nation produces each year, the United States has the second-highest total GDP at purchasing power parity (China recently surpassed us), and the sixth-highest GDP per person in the world. We do not lack wealth; instead, we funnel wealth to the rich and deny it from the poor. If we stopped doing this, we would see a reduction in poverty and inequality, and there is reason to think that a corresponding reduction in crime would follow. We could make people act morally better simply by redistributing wealth.
Such knowledge of situational factors forces us to reconsider our ethical judgments on many subjects. It forces us to examine the ways that social, political, and economic systems influence our behavior in powerful ways. But we still have free will, and we still need to use it; in fact, in order to apply this research to our daily lives and public policies, we will need to exercise our free will very carefully.
Surprisingly, it isn’t really that we are lacking in rail network. We actually have more kilometers of rail than China or the EU—though shockingly little of it is electrified, and we had nearly twice as many kilometers of rail a century ago. But we use this rail network almost entirely for freight, not passengers.
Is it that we aren’t spending enough government funds? Sort of. But it’s worth noting that we cover a higher proportion of public transit costs with government funds than most other countries. How can this be? It’s because transit systems get more efficient as they get larger, and attract more passengers as they provide better service. So when you provide really bad service, you end up spending more per passenger, and you need more government subsidies to stay afloat.
This isn’t comparing with China—of course China is cheaper; they have a dictatorship, they abuse their workers, they pay peanuts. None of that is true of France or Germany, democracies where wages are just as high and worker protections are actually a good deal stronger than here. Yet it still costs two to seven times as much to build the same amount of rail in the US as it does in France or Germany.
Another part of the problem seems to be that public transit in the US is viewed as a social welfare program, rather than an infrastructure program: Rather than seeing it as a vital function of government that supports a strong economy, we see it as a last resort for people too poor to buy cars. And then it becomes politicized, because the right wing in the US hates social welfare programs and will do anything to make sure that they are cut down as much as possible.
It wasn’t always this way.
As recently as 1970, most US major cities had strong public transit systems. But now it’s really only the coastal cities that have them; cities throughout the South and Midwest have massively divested from their public transit. This goes along with a pattern of deindustrialization and suburbanization: These cities are stagnating economically and their citizens are moving out to the suburbs, so there’s no money for public transit and there’s more need for roads.
Once public transit starts failing, it becomes a vicious cycle: They lose revenue, so they cut back on service, so they become more inconvenient, so they lose more revenue. Really successful public transit systems require very heavy investment in order to maintain fast, convenient service across an entire city. Any less than that, and people will just turn to cars instead.
Currently, the public transit systems in most US cities are suffering severe financial problems, largely as a result of the pandemic; they are facing massive shortfalls in their budgets. The federal government often helps with the capital costs of buying vehicles and laying down new lines, but not with the operating costs of actually running the system.
There seems to be some kind of systemic failure in the US in particular; something about our politics, or our economy, or our culture just makes us uniquely bad at building and maintaining public transit.
What should we do about this?
One option would be to do nothing—laissez faire. Maybe cars are just a more efficient mode of transportation, or better for what Americans want, and we should accept that.
But when you look at the externalities involved, it becomes clear that this is not the right approach. While cars produce enormous amounts of pollution and carbon emissions, public transit is much, much cleaner. (Electric cars are better than diesel buses, but still worse than trams and light rail—and besides, the vast majority of cars use gasoline.) Just for clean air and climate change alone, we have strong reasons to want fewer cars and more public transit.
We need a fundamental shift in how Americans think about public transit. Not as a last resort for the poor, but as a default option for everyone. Not as a left-wing social welfare program, but as a vital component of our nation’s infrastructure.
Whenever people get stuck in traffic, instead of resenting other drivers (who are in exactly the same boat!), they should resent that the government hasn’t supported more robust public transit systems—and then they should go out and vote for candidates and policies that will change that.
Of course, with everything else that’s wrong with our economy and our political system, I can understand why this might not be a priority right now. But sooner or later we are going to need to fix this, or it’s just going to keep getting worse and worse.
We are of two minds about housing in our society. On the one hand, we recognize that shelter is a necessity, and we want it to be affordable for all. On the other hand, we see real estate as an asset, and we want it to appreciate in value and thereby provide a store of wealth. So on the one hand we want it to be cheap, but on the other hand we want it to be expensive. And of course it can’t be both.
This is not a uniquely American phenomenon. As Noah Smith points out, it seems to be how things are done in almost every country in the world. It may be foolish for me to try to turn such a tide. But I’m going to try anyway.
Housing should be cheap.
For some reason, inflation is seen as a bad thing for every other good, necessity and luxury alike; but when it comes to housing in particular—the single biggest expense for almost everyone—suddenly we are conflicted about it, and think that maybe inflation is a good thing actually.
This is because owning a home that appreciates in value provides the illusion of increasing wealth.
Yes, I said illusion. In some particular circumstances it can sometimes increase real wealth, but when housing is getting more expensive everywhere at once (which is basically true), it doesn’t actually increase real wealth—because you still need to have a home. So while you’d get more money if you sold your current home, you’d have to go buy another home that would be just as expensive. That extra wealth is largely imaginary.
In fact, what isn’t an illusion is your increased property tax bill. If you aren’t planning on selling your home any time soon, you should really see its appreciation as a bad thing; now you suddenly owe more in taxes.
Home equity lines of credit complicate this a bit; for some reason we let people collateralize part of the home—even though the whole home is already collateralized with a mortgage to someone else—and thereby turn that largely-imaginary wealth into actual liquid cash. This is just one more way that our financial system is broken; we shouldn’t be offering these lines of credit, just as we shouldn’t be creating mortgage-backed securities. Cleverness is not a virtue in finance; banking should be boring.
But you’re probably still not convinced. So I’d like you to consider a simple thought experiment, where we take either view to the extreme: Make housing 100 times cheaper or 100 times more expensive.
In Cheap World, there is no homelessness. Seriously, zero. It would make no sense at all for the government not to simply buy everyone a house. If you want to also buy your own house—or a dozen—go ahead, that’s fine; but you get one for free, paid for by tax dollars, because that’s cheaper than a year of schooling for a high-school student; it’s in fact not much more than what we’d currently spend to house someone in a homeless shelter for a year. So given the choice of offering someone two years at a shelter versus never homeless ever again, it’s pretty obvious we should choose the latter. Thus, in Cheap World, we all have a roof over our heads. And instead of storing their wealth in their homes in Cheap World, people store their wealth in stocks and bonds, which have better returns anyway.
In Expensive World, the top 1% are multi-millionaires who own homes, maybe the top 10% can afford rent, and the remaining 89% of the population are homeless. There’s simply no way to allocate the wealth of our society such that a typical middle class household has $40 million. We’re just not that rich. We probably never will be that rich. It may not even be possible to make a society that rich. In Expensive World, most people live in tents on the streets, because housing has been priced out of reach for all but the richest families.
Cheap World sounds like an amazing place to live. Expensive World is a horrific dystopia. The only thing I changed was the price of housing.
Yes, I changed it a lot; but that was to make the example as clear as possible, and it’s not even as extreme as it probably sounds. At 10% annual growth, 100 times more expensive only takes 49 years. At the current growth rate of housing prices of about 5% per year, it would take 95 years. A century from now, if we don’t fix our housing market, we will live in Expensive World. (Yes, we’ll most likely be richer then too; but will we be that much richer? Median income has not been rising nearly as fast as median housing price. If current trends continue, median income will be 5 times bigger and housing prices will be 100 times bigger—that’s still terrible.)
I think part of the problem is that people don’t really understand what wealth is. They see the number go up, and they think that means there is more wealth. Real wealth consists in goods, not in prices. The wealth we have is made of real things, not monetary prices. Prices merely decide how wealth is allocated.
A home is wealth, yes. But it’s the same amount of real wealth regardless of what price it has, because what matters is what it’s good for. If you become genuinely richer by selling an appreciated home, you gained that extra wealth from somewhere else; it was not contained within your home. You have appropriated wealth that someone else used to have. You haven’t created wealth; you’ve merely obtained it.
For you as an individual, that may not make a difference; you still get richer. But as a society, it makes all the difference: Moving wealth around doesn’t make our society richer, and all higher prices can do is move wealth around.
This means that rising housing prices simply cannot make our whole society richer. Better houses could do that. More houses could do that. But simply raising the price tag isn’t making our society richer. If it makes anyone richer—which, again, typically it does not—it does so by moving wealth from somewhere else. And since homeowners are generally richer than non-homeowners (even aside from their housing wealth!), more expensive homes means moving wealth from poorer people to richer people—increased inequality.
We used to have affordable housing, just a couple of generations ago. But we may never have truly affordable housing again, because people really don’t like to see that number go down, and they vote for policies accordingly—especially at the local level. Our best hope right now seems to be to keep it from going up faster than the growth rate of income, so that homes don’t become any more unaffordable than they already are.
But frankly I’m not optimistic. I think part of the cyberpunk dystopia we’re careening towards is Expensive World.
For concreteness, I’ll use men and women as my example, though the same principles would apply for race, sexual orientation, and so on. Suppose we find that there are more men than women in a given profession; does this mean that women are being discriminated against?
Not necessarily. Maybe women are less interested in that kind of work, or innately less qualified. Is there a way we can determine empirically that it really is discrimination?
It turns out that there is. All we need is a reliable measure of performance in that profession. Then, we compare performance between men and women, and that comparison can tell us whether discrimination is happening or not. The key insight is that workers in a job are not a random sample; they are a selected sample. The results of that selection can tell us whether discrimination is happening.
Here’s a simple model to show how this works.
Suppose there are five different skill levels in the job, from 1 to 5 where 5 is the most skilled. And suppose there are 5 women and 5 men in the population.
1. Baseline
The baseline case to consider is when innate talents are equal and there is no discrimination. In that case, we should expect men and women to be equally represented in the profession.
For the simplest case, let’s say that there is one person at each skill level:
Men
Women
1
1
2
2
3
3
4
4
5
5
Now suppose that everyone above a certain skill threshold gets hired. Since we’re assuming no discrimination, the threshold should be the same for men and women. Let’s say it’s 3; then these are the people who get hired:
Hired Men
Hired Women
3
3
4
4
5
5
The result is that not only are there the same number of men and women in the job, their skill levels are also the same. There are just as many highly-competent men as highly-competent women.
2. Innate Differences
Now, suppose there is some innate difference in talent between men and women for this job. For most jobs this seems suspicious, but consider pro sports: Men really are better at basketball, in general, than women, and this is pretty clearly genetic. So it’s not absurd to suppose that for at least some jobs, there might be some innate differences. What would that look like?
Again suppose a population of 5 men and 5 women, but now the women are a bit less qualified: There are two 1s and no 5s among the women.
Men
Women
1
1
2
1
3
2
4
3
5
4
Then, this is the group that will get hired:
Hired Men
Hired Women
3
3
4
4
5
The result will be fewer women who are on average less qualified. The most highly-qualified individuals at that job will be almost entirely men. (In this simple model, entirely men; but you can easily extend it so that there are a few top-qualified women.)
This is in fact what we see for a lot of pro sports; in a head-to-head match, even the best WNBA teams would generally lose against most NBA teams. That’s what it looks like when there are real innate differences.
But it’s hard to find clear examples outside of sports. The genuine, large differences in size and physical strength between the sexes just don’t seem to be associated with similar differences in mental capabilities or even personality. You can find some subtler effects, but nothing very large—and certainly nothing large enough to explain the huge gender gaps in various industries.
3. Discrimination
What does it look like when there is discrimination?
Now assume that men and women are equally qualified, but it’s harder for women to get hired, because of discrimination. The key insight here is that this amounts to women facing a higher threshold. Where men only need to have level 3 competence to get hired, women need level 4.
So if the population looks like this:
Men
Women
1
1
2
2
3
3
4
4
5
5
The hired employees will look like this:
Hired Men
Hired Women
3
4
4
5
5
Once again we’ll have fewer women in the profession, but they will be on average more qualified. The top-performing individuals will be as likely to be women as they are to be men, while the lowest-performing individuals will be almost entirely men.
This is the kind of pattern we observe when there is discrimination. Do we see it in real life?
This shows that there is some discrimination happening, somewhere in the process. Does it mean that individual firms are actively discriminating in their hiring process? No, it doesn’t. The discrimination could be happening somewhere else; maybe it happens during education, or once women get hired. Maybe it’s a product of sexism in society as a whole, that isn’t directly under the control of employers. But it must be in there somewhere. If women are both rarer and more competent, there must be some discrimination going on.
What if there is also innate difference? We can detect that too!
4. Both
Suppose now that men are on average more talented, but there is also discrimination against women. Then the population might look like this:
Men
Women
1
1
2
1
3
2
4
3
5
4
And the hired employees might look like this:
Hired Men
Hired Women
3
4
5
4
In such a scenario, you’ll see a large gender imbalance, but there may not be a clear difference in competence. The tiny fraction of women who get hired will perform about as well as the men, on average.
Of course, this assumes that the two effects are of equal strength. In reality, we might see a whole spectrum of possibilities, from very strong discrimination with no innate differences, all the way to very large innate differences with no discrimination. The outcomes will then be similarly along a spectrum: When discrimination is much larger than innate difference, women will be rare but more competent. When innate difference is much larger than discrimination, women will be rare and less competent. And when there is a mix of both, women will be rare but won’t show as much difference in competence.
Moreover, if you look closer at the distribution of performance, you can still detect the two effects independently. If the lowest-performing workers are almost all men, that’s evidence of discrimination against women; while if the highest-performing workers are almost all men, that’s evidence of innate difference. And if you look at the table above, that’s exactly what we see: Both the 3 and the 5 are men, indicating the presence of both effects.
What does affirmative action do?
Effectively, affirmative action lowers the threshold for hiring women (or minorities) in order to equalize representation in the workplace. In the presence of discrimination raising that threshold, this is exactly what we need! It can take us from case 3 (discrimination) to case 1 (equality), or from case 4 (both discrimination and innate difference) to case 2 (innate difference only).
Of course, it’s possible for us to overshoot, using more affirmative action than we should have. If we achieve better representation of women, but the lowest performers at the job are women, then we have overshot, effectively now discriminating against men. Fortunately, there is very little evidence of this in practice. In general, even with affirmative action programs in place, we tend to find that the lowest performers are still men—so there is still discrimination against women that we’ve failed to compensate for.
What if we can’t measure competence?
Of course, it’s possible that we don’t have good measures of competence in a given industry. (One must wonder how firms decide who to hire, but frankly I’m prepared to believe they’re just really bad at it.) Then we can’t observe discrimination statistically in this way. What do we do then?
But this will only pick up discrimination if it occurs during the hiring process. The advantage of having a competence measure is that it can detect discrimination that occurs anywhere—even outside employer control. Of course, if we don’t know where the discrimination is happening, that makes it very hard to fix; so the two approaches are complementary.
And there is room for new methods too; right now we don’t have a good way to detect discrimination in promotion decisions, for example. Many of us suspect that it occurs, but unless you have a good measure of competence, you can’t really distinguish promotion discrimination from innate differences in talent. We don’t have a good method for testing that in a direct experiment, either, because unlike hiring, we can’t just use fake resumes with masculine or feminine names on them.
There has been unusually high inflation the past few years, mostly attributable to the COVID pandemic and its aftermath. But groceries in particular seem to have gotten especially more expensive. We’ve all felt it: Eggs, milk, and toilet paper especially soared to extreme prices and then, even when they came back down, never came down all the way.
Why would this be?
Did it involve supply chain disruptions? Sure. Was it related to the war in Ukraine? Probably.
But it clearly wasn’t just those things—because, as the FTC recently found, grocery stores have been colluding and price-gouging. Large grocery chains like Walmart and Kroger have a lot of market power, and they used that power to raise prices considerably faster than was necessary to keep up with their increased costs; as a result, they made record profits. Their costs did genuinely increase, but they increased their prices even more, and ended up being better off.
The big chains were also better able to protect their own supply chains than smaller companies, and so the effects of the pandemic further entrenched the market power of a handful of corporations. Some of them also imposed strict delivery requirements on their suppliers, pressuring them to prioritize the big companies over the small ones.
This kind of thing is what happens when we let oligopolies take control. When only a few companies control the market, prices go up, quality goes down, and inequality gets worse.
For far too long, institutions like the FTC have failed to challenge the ever tighter concentration of our markets in the hands of a small number of huge corporations.
And most of these lists used to be longer. Disney recently acquired 21st Century Fox. Viacom recently merged with CBS and then became Paramount. Universal recently acquired EMI. Our markets aren’t simply alarmingly concentrated; they have also been getting more concentrated over time.
Institutions like the FTC are supposed to be protecting us from oligopolies, by ensuring that corporations can’t merge and acquire each other once they reach a certain market share. But decades of underfunding and laissez-faire ideology have weakened these institutions. So many mergers that obviously shouldn’t have been allowed were allowed, because no regulatory agency had the will and the strength to stop them.
Hopefully this is a sign that the FTC has found its teeth again, and will continue to prosecute anti-trust cases against oligopolies. A lot of that may depend on who ends up in the White House this November.
The concept of adverse selection is normally associated with finance and insurance, and they certainly do have a lot of important applications there. But finance and insurance are complicated (possibly intentionally?) and a lot of people are intimidated by them, and it turns out there’s a much simpler example of this phenomenon, which most people should find familiar:
All-you-can-eat meals.
At most restaurants, you buy a specific amount of food: One cheeseburger, one large order of fries. But at some, you have another option: You can buy an indeterminate amount of food, as much as you are able to eat at one sitting.
Now think about this from the restaurant’s perspective: How do you price an all-you-can-eat meal and turn a profit? Your cost obviously depends on how much food you need to prepare, but you don’t know exactly how much each customer is going to eat.
Fortunately, you don’t need to! You only need to know how much people will eat on average. As long as the average customer’s meal is worth less than what they paid for it, you will continue to make a profit, even though some customers end up eating more than what they paid for.
Insurance works the same way: Some people will cash in on their insurance, costing the company money; but most will not, providing the company with revenue. In fact, you could think of an all-you-can-eat-meal as a form of food insurance.
So, all you need to do is figure out how much an average person eats in one meal, and price based on that, right?
Wrong. Here’s the problem: The people who eat at your restaurant aren’t a random sample of people. They are specifically the kind of people who eat at all-you-can-eat restaurants.
Someone who eats very little probably won’t want to go to your restaurant very much, because they’ll have to pay a high price for very little food. But someone with a big appetite will go to your restaurant frequently, because they get to eat a large amount of food for that same price.
This means that, on average, your customers will end up eating more than what an average restaurant customer eats. You’ll have to raise the price accordingly—which will make the effect even stronger.
This can end in one of two ways: Either an equilibrium is reached where the price is pretty high and most of the customers have big appetites, or no equilibrium is reached, and the restaurant either goes bankrupt or gets rid of its all-you-can-eat policy.
But there’s basically no way to get the outcome that seems the best, which is a low price and a wide variety of people attending the restaurant. Those who eat very little just won’t show up.
That’s adverse selection. Because there’s no way to charge people who eat more a higher price (other than, you know, not being all-you-can-eat), people will self-select by choosing whether or not to attend, and the people who show up at your restaurant will be the ones with big appetites.
The same thing happens with insurance. Say we’re trying to price health insurance; we don’t just need to know the average medical expenses of our population, even if we know a lot of specific demographic information. People who are very healthy may choose not to buy insurance, leaving us with only the less-healthy people buying our insurance—which will force us to raise the price of our insurance.
Once again, you’re not getting a random sample; you’re getting a sample of the kind of people who buy health insurance.
Obamacare was specifically designed to prevent this, by imposing a small fine on people who choose not to buy health insurance. The goal was to get more healthy people buying insurance, in order to bring the cost down. It worked, at least for awhile—but now that individual mandate has been nullified, so adverse selection will once again rear its ugly head. Had our policymakers better understood this concept, they might not have removed the individual mandate.
Another option might occur to you, analogous to the restaurant: What if we just didn’t offer insurance, and made people pay for all their own healthcare? This would be like the restaurant ending its all-you-can-eat policy and charging for each new serving. Most restaurants do that, so maybe it’s the better option in general?
There are two problems here, one ethical, one economic.
The ethical problem is that people don’t deserve to be sick or injured. They didn’t choose those things. So it isn’t fair to let them suffer or bear all the costs of getting better. As a society, we should share in those costs. We should help people in need. (If you don’t already believe this, I don’t know how to convince you of it. But hopefully most people do already believe this.)
The economic problem is that some healthcare is rarely needed, but very expensive. That’s exactly the sort of situation where insurance makes sense, to spread the cost around. If everyone had to pay for their own care with no insurance at all, then most people who get severe illnesses simply wouldn’t be able to afford it. They’d go massively into debt, go bankrupt—people already do, even with insurance!—and still not even get much of the care they need. It wouldn’t matter that we have good treatments for a lot of cancers now; they are all very expensive, so most people with cancer would be unable to pay for them, and they’d just die anyway.
In fact, the net effect of such a policy would probably be to make us all poorer, because a lot of illness and disability would go untreated, making our workforce less productive. Even if you are very healthy and never need health insurance, it may still be in your own self-interest to support a policy of widespread health insurance, so that sick people get treated and can go back to work.
A world without all-you-can-eat restaurants wouldn’t be so bad. But a world without health insurance would be one in which millions of people suffer needlessly because they can’t afford healthcare.
We’re accustomed to this situation, so it may not seem strange to you. But stop and think for a moment: What are the odds that across every industry, exactly 40 hours per week is the most efficient arrangement?
Indeed, there is mounting evidence that in many industries, 40 hours is too much, and something like 5 or even 30 would actually be more efficient. Yet we continue to work 40-hour weeks.
This looks like a corner solution: Rather than choosing an optimal amount, we’re all up against some kind of constraint.
What’s the constraint? Well, the government requires (for most workers) that anything above 40 hours per week must be paid as overtime, that is, at a higher wage rate. So it looks like we would all be working more than 40 hours per week, but we hit the upper limit due to these regulations.
Does this mean we would be better off without the regulations? Clearly not. As I just pointed out, the evidence is mounting that 40 hours is too much, not too little. But why, then, would we all be trying to work so many hours?
I believe this is yet another example of hyper-competition, where competition drives us to an inefficient outcome.
Employers value employees who work a lot of hours. Indeed, I contend that they do so far more than makes any rational sense; they seem to care more about how many hours you work than about the actual quality or quantity of your output. Maybe this is because hours worked is easier to measure, or because it seems like a fairer estimate of your effort; but for whatever reason, employers really seem to reward employees who work a lot of hours, regardless of almost everything else.
In the absence of a limit on hours worked, then, employers are going to heap rewards on whoever works the most hours, and so people will be pressured to work more and more hours. Then we would all work ourselves to death, and it’s not even clear that this would be good for GDP.
But speaking of norms, that also seems to be a big factor here. The truth is, overtime isn’t really that expensive, and employers could be smarter about rewarding good work rather than more hours. But once a norm establishes itself in a society, it can be very hard to change. And right now, the norm is that 40 hours is a “normal” “standard” “full” work week—any more is above and beyond, and any less is inferior.
This is a problem, because a lot of people can’t work 40-hour weeks. Our standard for what makes someone “disabled” isn’t that you can’t work at all; it’s that you can’t work as much as society expects. I wonder how many people are currently living on disability who could have been working part-time, but there just weren’t enough part-time jobs available. The employment rate among people with a disability is only 41%, compared to 77% of the general population.
And it’s not that we need to work this much. Our productivity is now staggeringly high: We produce more than five times as much wealth per hour of work than we did as recently as the 1940s. So in theory, we should be able to live just as well while working one-fifth as much… but that’s clearly not what happened.
Indeed, it doesn’t even seem like we live five times as well while working just as much. Many things are better now—healthcare, entertainment, and of course electronics—but somehow, we really don’t feel like we are living better lives than our ancestors.
Up until about 1980, productivity and pay rose in lockstep. But then they started to diverge, and they never again converged. Productivity continued to soar, while real wages only barely increased. The result is that since then, productivity has grown by 64%, and hourly pay has only grown 15%.
This is definitely part of the problem, but I think there’s more to it as well. Housing and healthcare have become so utterly unaffordable in this country that it really doesn’t matter that our cars are nice and our phones are dirt cheap. We are theoretically wealthier now, but most of that extra wealth goes into simply staying healthy and having a home. Our consumption has been necessitized.
If we can solve these problems, maybe people won’t feel a need to work so many hours. Or, maybe competition will continue to pressure them to work those hours… but at least we’ll actually feel richer when we do it.