Mar 22 JDN 2461122
In my previous post I reflected on the ways that conventional measures of poverty seem inadequate—and that a richer understanding of poverty suggests that it is far more ubiquitous than such measures suggest.
In this post, I will ask: Given this richer understanding of poverty, what would a world without poverty look like? Is it something we can realistically hope to achieve?
In techno-utopian circles (looking at you again, Scott Alexander), it is common to speak of “post-scarcity”: A world where there is no poverty because resources are effectively unlimited.
I don’t think that’s possible.
Not for humans as we know them. Perhaps in a future where greed is a recognized and treatable psychiatric disorder, we could genuinely have an economy where people really just take whatever they want and it works out because nobody wants an unreasonable amount.
But the fact that there are people with hundreds of billions of dollars tells me that among humans as we know them, some people’s greed is just literally insatiable. Give them a moon and they’ll demand a planet; give them a planet and they’ll demand a solar system. Whatever they are getting out of more wealth (status? power? the dopamine hit of number go up?), they’re never going to stop getting it from even more wealth, no matter how much we give them. For if they were going to stop at a reasonable amount, they would have stopped four orders of magnitude ago.
So let’s try to imagine what a world would look like if it really had no poverty, but not by somehow producing such staggering amounts of wealth that everyone could literally take whatever they want.
I think the key is that it would require all basic material needs to be met.
Everyone would have, at minimum:
- Clean air to breathe
- Clean water to drink
- Nutritious food to eat
- Shelter from the elements
- Security against theft and violence
- Personal liberty and political representation
- A basic education
- A basic standard of healthcare
(I will note that these resonate quite closely with the UN Universal Declaration of Human Rights.)
Some of these needs can probably never be completely satisfied—there is an inherent tension between liberty and security which requires us to balance them against each other. A society with zero crime is a horrific totalitarian police state; a society with complete liberty is an equally horrific Hobbesian nightmare. But we have achieved, in most of the First World at least, a reasonable standard of security along with a great deal of liberty, and preserving that balance should be of a very high priority.
Even clean air and water would be difficult to satisfy perfectly: even if we pivot our whole economy to solar, wind, and nuclear power (as we very definitely should be doing!), some amount of pollution is probably necessary just to have a functioning industrial society. So we need to establish reasonable standards for what amounts of pollution exposure are safe, and effective mechanisms for ensuring that people are not exposed to pollution outside those standards—we have largely done the former, but seriously fail at the latter.
But probably the most difficult needs to satisfy are actually difficult to even define.
Just what constitutes a basic standard of education, and a basic standard of healthcare?
These seem like moving targets.
Let’s start with education:
Someone who is illiterate and can barely add two numbers together would be considered to have very poor education today, but would be considered completely average among peasants in the Middle Ages. Someone like me with a PhD has education well beyond what anyone had in the Middle Ages: While Oxford was already graduating doctors in the 12th century, those doctors didn’t have to write dissertations, and didn’t know nearly as much about the world as you must to earn a modern PhD. (Most of the mathematics required to get an economics PhD specifically literally had not been invented.)
So it’s conceivable that educational standards will continue to rise over time, especially if we are able to radically improve learning via new technologies. In the most extreme case, if everyone can just download knowledge like in The Matrix, then it wouldn’t be unreasonable to expect the average person to know as much as a typical PhD today in dozens of fields.
Suppose that such technology did exist. Would it be fair to consider someone poor if they didn’t have access to it?
Yes, I think it would.
Because if it’s really cheap and easy to give breathtakingly vast knowledge on a variety of subjects to anyone instantly, then letting some people have that while others do not puts those others at a severe disadvantage in life. If you must know how to solve partial differential equations to get a job, then someone who only made it through high school algebra isn’t going to be able to find jobs.
So I think what we’re really concerned about here is inequality: The education of a rich person should not be too much better than the education of a poor person, lest “meritocracy” simply reinforce the same generational inequality it was supposed to eliminate.
Now consider healthcare:
This, too, has radically improved over time. Indeed, I’m not really sure it’s fair to call Medieval doctors doctors at all; they lacked basic knowledge of human physiology and their intervention was as likely to hurt patients as to help them. Surgeons certainly existed: They knew how to amputate a gangrenous limb or suture a wound. (They did so without antiseptic, let alone anaesthetic!) But should you come to them with a fever or a headache, they would likely do you as much harm as good.
So we could imagine a world of Star Trek medicine, where you lie in a bed, get scanned for a few moments, and the doctor immediately knows what’s wrong with you and what kind of painless injection to give you to fix it.
Once again, we must ask: If you don’t have that, are you poor?
And again, I’m going to say yes.
If the technology exists to heal people this effortlessly, and some people get access to it while others do not, the latter are being allowed to suffer when their suffering could be easily alleviated.
But now we must consider: what if the technology exists, but it’s too expensive to use routinely?
Most technologies are like this when they are first invented. Over time, the technology improves (and the patents expire!) and they become cheaper and more widely available.
Unlike education, healthcare doesn’t usually impose large advantages on those who receive it—though it can, especially in a society where disabilities are not adequately accommodated.
So I think I’m prepared to allow “early adopters” of new medical technology, people who are rich enough to pay for advanced treatments before they are available to everyone—within certain limits. If some new treatment grants radically higher productivity or lifespan, then in fact I think we have a moral obligation to wait until it can be universally shared before we give it to anyone—precisely because of the risk of reinforcing generational inequality.
Once again, in our effort to define poverty, we end up returning to inequality: The rich should not be allowed to be too much healthier than the poor.
This definitely makes education and healthcare more complicated than the others.
While we can pretty clearly define how much food and water a human being needs to live, and we could provide it to everyone, and then nobody would be poor in terms of food or water.
But making nobody poor in terms of education and healthcare requires meeting a standard that may in fact increase over time, and it is no contradiction to imagine that someone living in the 31st century could be receiving better healthcare than I ever will and yet is still not receiving adequate healthcare based on the technology available.
Furthermore, that person demanding better healthcare is not being ungrateful or envious—they are quite reasonably demanding that society fairly allocate healthcare so that there aren’t some people who live in eternal youth while other people still die of old age.
Are they richer than I am? In some sense, perhaps. We could stipulate that in every material way they are better off than I am now. But there’s a treatment that could extend their life by centuries, and nobody’s giving it to them, because they can’t afford it—and that’s wrong. That makes them poor, and it makes their society unfair and unjust. It isn’t just a question of how many QALY they have; it’s also a question of what it would cost to give them a lot more.
But with all that said, I do believe that a world without poverty is possible.
In fact, I believe that technologically we could already provide that world, if we had the political will to do so. Maybe we don’t quite have the economic output to support it worldwide, but even that is not as far off as most people seem to think.
Providing an adequate standard of food and water, for example, we could already do with existing food supplies. It would cost about one-eighth of Elon Musk’s wealth per year, meaning that, with good stock returns (as he most certainly gets), he could very likely afford it by himself!
Clean air for all would be harder, but we are moving the right direction now that solar power is so cheap.
Universal liberty and security would require radical shifts in government in dozens of countries, so that one seems especially unlikely to happen any time soon—yet it is very definitely possible, and by construction only requires political change.
Universal education and healthcare would be very expensive, and most countries are too poor to really provide them on their own. They are not simply poor in money, but poor in skills: There aren’t enough doctors and teachers, and so we would need to use the ones we have to train up a new generation, and perhaps a new generation after that, before the world’s needs would really be met. (Fortunately, there are people trying to do this. But they don’t have enough resources to really achieve these goals.) So this is not a technological limitation, but it is an economic one; it will probably be at least another generation before we can solve this one.
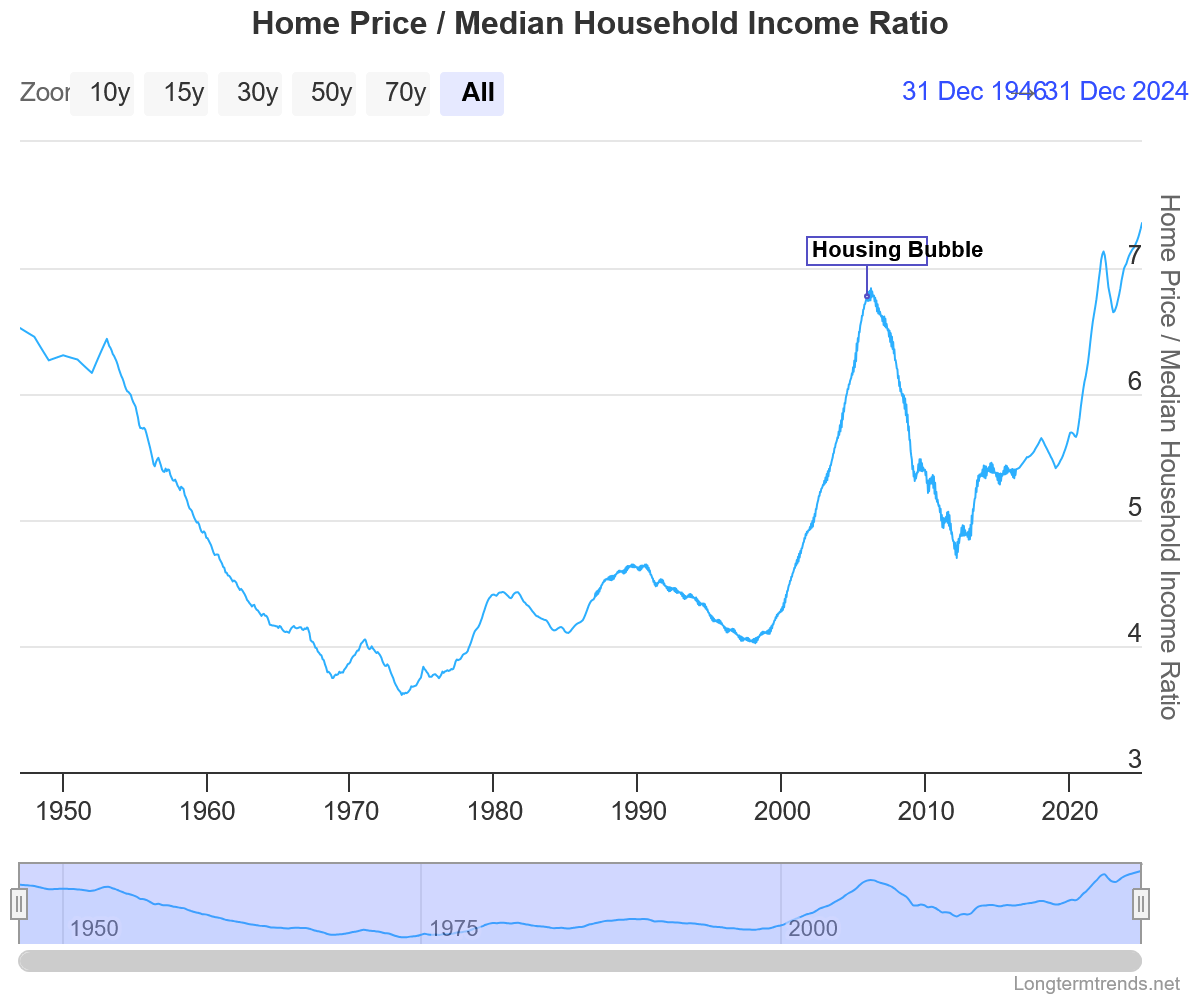
What about universal shelter? Now there’s the rub. Even in prosperous First World countries, housing shortages and skyrocketing prices are keeping homeownership out of reach for tens of millions of people, and leaving hundreds of thousands outright homeless. We clearly do have the technology to produce enough homes, especially if we are prepared to build at high density; but the economic cost of doing so would be substantial, and our policymakers don’t seem at all willing to actually pay it. I think as long as housing is viewed as an asset one invests in rather than a good that one needs, this will continue to be the case.
The problem isn’t that we don’t have enough stuff. It’s that we are not sharing it properly.