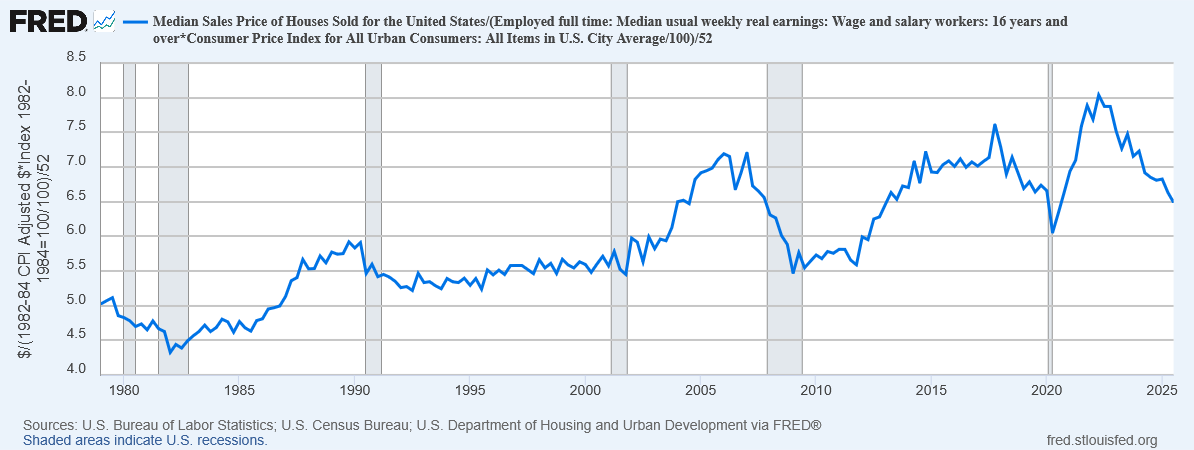
The graph below, constructed from FRED data, provides a simple measure of housing affordability: How many years of median earnings does it take to afford the median home?
From a low of 4.4 in 1982, this rose to about 5.5 and was relatively stable in the 1990s. Then in the 2000s, it began to rise, peaked at 7.2 just before the housing crisis, and then rapidly dropped to back to 5.5 again.
Then in the 2010s it began to rise again, peaked even higher at 7.6 in 2017, and then dropped down to 6.0 in 2020 before beginning to rise anew. In 2023 it reached a yet higher peak of 8.0, and then has been slowly declining ever since—but is still about 6.5, well above its 1990s level.
I honestly expected worse than this, but I think part of what’s happening is that new homes have gotten a bit smaller in the past few years: median square footage of homes sold has fallen from a peak of 1997 in 2019 to 1788 today. (Unfortunately, FRED doesn’t have this data series going back any earlier than 2016.)
If we adjust for that, the price a typical 2019 home today would be about 7.2 years of median earnings, which is about what it was at the peak of the housing crisis in 2007.
Note of course this isn’t actually how many years you need to save up to buy a house. You clearly can’t save your entire earnings, but you also don’t need to come up with the full price, only the down payment. And what you can afford also depends upon interest rates and such. But still, it’s a pretty clear sign that housing is radically more expensive now than it was in the 1980s or even 1990s.
In my view, this is the affordability crisis.
Gas prices really aren’t that important. Car prices are relatively stable. Food prices are volatile but don’t have a bad long-term trend. We do still have serious problems with affordability in education and healthcare, but we have obvious solutions available (that several other countries are already doing successfully); we’re just not doing them because Republicans don’t like them. But housing? We have no clear solutions on the table, certainly not anything that would be politically viable. Fundamentally, we need to build more housing in places people want to live—a lot more housing—and force the price of housing down.
And with our society structured the way it is, when you price people out of housing, you price them out of adulthood. Millennials are not having kids at anywhere near the rate of previous generations, because raising kids requires living space. Especially with immigration collapsing after Trump, this housing affordability crisis is going to turn into a population crisis.
I guess what I’m hoping for at the moment is just consciousness-raising, making people see that this is actually a problem. For some reason, everyone agrees that rising prices of goods are a bad thing, except when it comes to housing.
Inflation in food? An urgent crisis that must be immediately resolved.
Inflation in gas prices? So terrible it’s worth invading other countries over.
Inflation in housing? No, somehow that’s good actually, because it makes homeowners feel richer (even though they actually owe more in property taxes). We treat housing like an asset instead of a good, which is something we should absolutely never, ever do with a good that people need to live.
I was only able to find sufficient data to calculate the Index of Necessary Expenditure back to 1990. But I found a fairly consistent pattern that the INE grew at a rate about 20% faster than the CPI over that period, so I decided to take a look at what longer-term income growth looks like if we extrapolate that pattern back further in time.
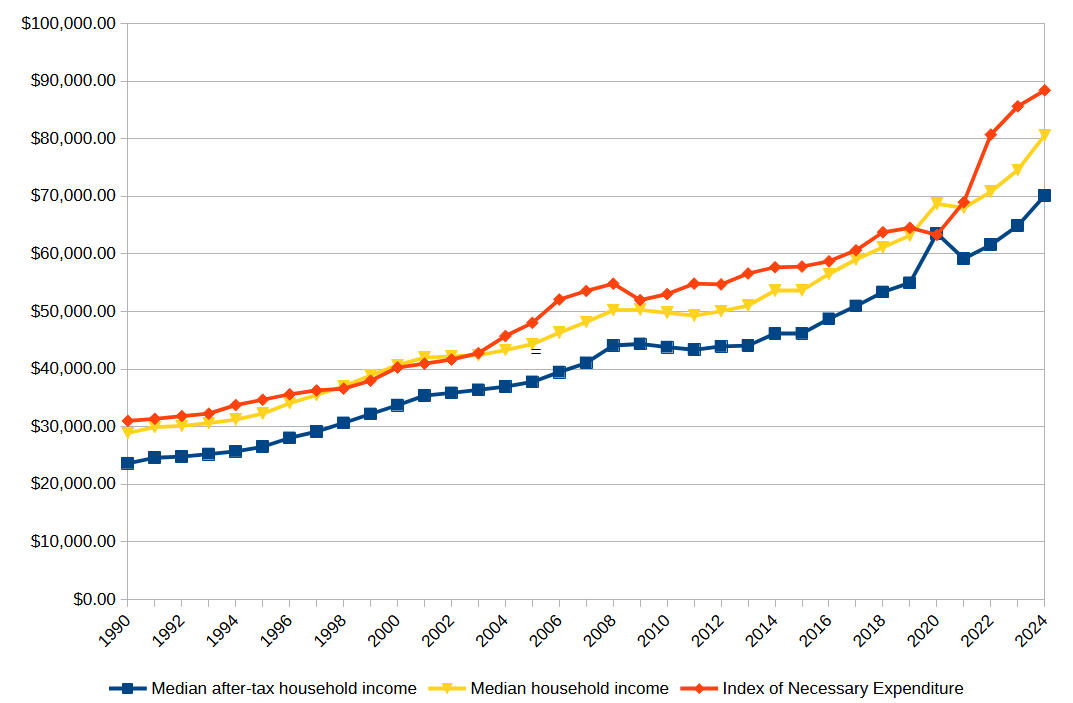
The result is this graph:
Using the CPI, real per-capita GDP in the US (in 2024 dollars) has grown from $25,760 in 1950 to $85,779 today—increasing by a factor of 3.33. Even accounting for increased inequality and the fact that more families have two income earners, that’s still a substantial increase.
But using the extrapolated INE, real per-capita GDP has only grown from $43,622 in 1950 to $85,779 today—increasing by only a factor of 1.97. This is a much smaller increase, especially when we adjusted for increased inequality and increased employment for women.
Even without the extrapolation, it’s still clear that real INE-adjusted incomes have were basically stagnant in the 2000s, increased rather slowly in the 2020s, and then actually dropped in 2022 after a bunch of government assistance ended. What looked, under the CPI, like steadily increasing real income was actually more like treading water.
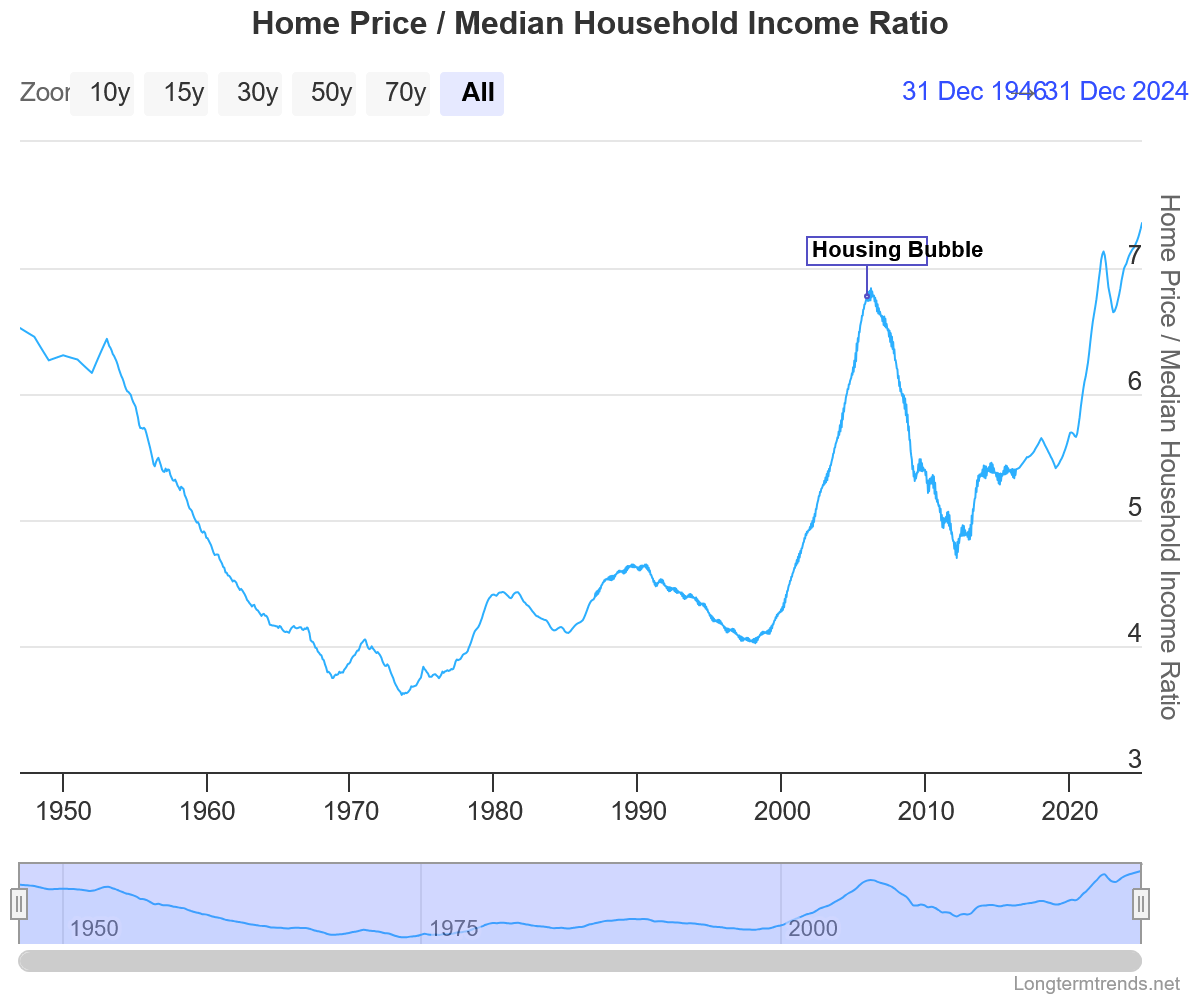
This ratio was around 6 in the 1950s, then began to fall until in the 1970s it stabilized around 4. It began to slowly creep back up, but then absolutely skyrocketed in the 2000s before the 2008 crash. Now it has been rising again, and is now above 7, the highest it has been since the Second World War. (Does this mean we’re due for another crash? I’d bet as much.)
What does this mean? It means that a typical family used to be able to afford a typical house with only four years of their total income—and now would require seven. In that sense, homes are now 75% more expensive today than they were in the 1970s.
Similar arguments can be made for the rising costs of education and healthcare; while many prices have not grown much (gasoline) or even fallen (jewelry and technology), these necessities have continued to grow more and more expensive, not simply in nominal terms, but even compared to the median income.
This is further evidence that our standard measures of “inflation” and “real income” are fundamentally inadequate. They simply aren’t accurately reflecting the real cost of living for most American families. Even in many times when it seemed “inflation” was low and “real income” was growing, in fact it was growing harder and harder to afford vital necessities such as housing, education, and healthcare.
This economic malaise may have been what contributed to the widespread low opinion of Biden’s economy. While the official figures looked good, people’s lives weren’t actually getting better.
Yet this is still no excuse for those who voted for Trump; even the policies he proudly announced he would do—like tariffs and deportations—have clearly made these problems worse, and this was not only foreseeable but actually foreseen by the vast majority of the world’s economists. Then there are all the things he didn’t even say he would do but is now doing, like cozying up to Putin, alienating our closest allies, and discussing “methods” for achieving an unconstitutional third term.
Indeed, it honestly feels quite futile to even reflect upon what was wrong with our economy even when things seemed to be running smoothly, because now things are rapidly getting worse, and showing no sign of getting better in any way any time soon.
In last week’s post I constructed an Index of National Expenditure (INE), attempting to estimate the total cost of all of the things a family needs and can’t do without, like housing, food, clothing, cars, healthcare, and education. What I found shocked me: The median family cannot afford all necessary expenditures.
I have a couple more thoughts about that.
I still don’t understand why people care so much about gas prices.
Gasoline was a relatively small contribution to INE. It was more than clothing but less than utilities, and absolutely dwarfed by housing, food, or college. I thought maybe since I only counted a 15-mile commute, maybe I didn’t actually include enoughgasoline usage, but based on this estimate of about $2000 per driver, I was in about the right range; my estimate for the same year was $3350 for a 2-car family.
I think I still have to go with my salience hypothesis: Gasoline is the only price that we plaster in real-time on signs on the side of the road. So people are constantly aware of it, even though it isn’t actually that important.
The price surge that should be upsetting people is housing.
If the price of homes had only risen with the rate of CPI inflation instead of what it actually did, the median home price in 2024 would be only $234,000 instead of the $396,000 it actually is; and by my estimation that would save a typical family $11,000 per year—a whopping 15% of their income, and nearly enough to make the INE affordable by itself.
Now, I’ll consider some possible objections to my findings.
Objection 1: A typical family doesn’t actually spend this much on these things.
You’re right, they don’t! Because they couldn’t possibly. Even with substantial debt, you just can’t sustainably spend 125% of your after-tax household income.
My goal here was not to estimate how much families actually spend; it was to estimate how much they need to spend in order to live a good life and not feel deprived.
What I have found is that most American families feel deprived. They are forced to sacrifice something really important—like healthcare, or education, or owning a home—because they simply can’t afford it.
What I’m trying to do here is find the price of the American Dream; and what I’ve found is that the American Dream has a price that most Americans cannot afford.
Objection 2: You should use median healthcare spending, not mean.
I did in fact use mean figures instead of median for healthcare expenditures, mainly because only the mean was readily available. Mean income is higher than median income, so you might say that I’ve overestimated healthcare expenditure—and in a sense that’s definitely true. The median family spends less than this on healthcare.
But the reason that the median family spends less than this on healthcare is not that they want to, but that they have to. Healthcare isn’t a luxury that people buy more of because they are richer. People buy either as much as they need or as much as they can afford—whichever is lower, which is typically the latter. Using the mean instead of the median is a crude way to account for that, but I think it’s a defensible one.
But okay, let’s go ahead and cut the estimate of healthcare spending in half; even if you do that, the INE is still larger than after-tax median household income in most years.
Objection 3: A typical family isn’t a family of four, it’s a family of three.
Part of what I seem to be finding here is that a family of four is unaffordable—literally impossible to afford—on a typical family income.
But a healthy society is one in which typical families have two or three children. That is what we need in order to achieve population replacement. When families get smaller than that, we aren’t having enough children, and our population will decline—which means that we’ll have too many old people relative to young people. This puts enormous pressure on healthcare and pension systems, which rely upon the fact that young people produce more, in order to pay for the fact that old people cost more.
This is bad. This is not sustainable. If the reason families aren’t having enough kids is that they can’t afford them—and this fits with other research on the subject—then this economic failure damages our entire society, and it needs to be fixed.
Objection 4: Many families buy their cars used.
Perhaps 1/10 of a new car every year isn’t an ideal estimate of how much people spend on their cars, but if anything I think it’s conservative, because if you only buy a car every 10 years, and it was already used when you bought it, you’re going to need to spend a lot on maintaining it—quite possibly more than it would cost to get a new one. Motley Fool actually estimates the ownership cost of just one car at substantially more than I estimated for two cars. So if anything your complaint should be that I’ve underestimated the cost by not adequately including maintenance and insurance.
Objection 5: Not everyone gets a four-year college degree.
Fair enough; a substantial proportion get associate’s degrees, and most people get no college degree at all. But some also get graduate degrees, which is even more expensive (ask me how I know).
Moreover, in today’s labor market, having a college degree makes a huge difference in your future earnings; a bachelor’s degree increases your lifetime earnings by a whopping 84%. In theory it’s okay to have a society where most people don’t go to college; in practice, in our society, not going to college puts you at a tremendous disadvantage for the rest of your life. So we either need to find a way to bring wages up for those who don’t go to college, or find a way to bring the cost of college down.
This is probably one of the things that families actually choose to scrimp on, only sending one kid to college or none at all. But because college is such a huge determinant of earnings, this perpetuates intergenerational inequality: Only rich families can afford to send their kids to college, and only kids who went to college grow up to have rich families.
Objection 6: You don’t actually need to save for college; you can use student loans.
Yes, you can, and in practice, most people who to college do. But while this solves the liquidity problem (having enough money right now), it does not solve the solvency problem (having enough money in the long run). Failing to save for college and relying on student loans just means pushing the cost of college onto your children—and since we’ve been doing that for over a generation, feel free to replace the category “college savings” with “repaying student loans”; it won’t meaningfully change the results.
I’m still reeling from the fact that Donald Trump was re-elected President. He seemed obviously horrible at the time, and he still seems horrible now, for many of the same reasons as before (we all knew the tariffs were coming, and I think deep down we knew he would sell out Ukraine because he loves Putin), as well as some brand new ones (I did not predict DOGE would gain access to all the government payment systems, nor that Trump would want to start a “crypto fund”). Kamala Harris was not an ideal candidate, but she was a good candidate, and the comparison between the two could not have been starker.
Now that the dust has cleared and we have good data on voting patterns, I am now less convinced than I was that racism and sexism were decisive against Harris. I think they probably hurt her some, but given that she actually lost the most ground among men of color, racism seems like it really couldn’t have been a big factor. Sexism seems more likely to be a significant factor, but the fact that Harris greatly underperformed Hillary Clinton among Latina women at least complicates that view.
A lot of voters insisted that they voted on “inflation” or “the economy”. Setting aside for a moment how absurd it was—even at the time—to think that Trump (he of the tariffs and mass deportations!) was going to do anything beneficial for the economy, I would like to better understand how people could be so insistent that the economy was bad even though standard statistical measures said it was doing fine.
Krugman believes it was a “vibecession”, where people thought the economy was bad even though it wasn’t. I think there may be some truth to this.
But today I’d like to evaluate another possibility, that what people were really reacting against was not inflation per se but necessitization.
I first wrote about necessitization in 2020; as far as I know, the term is my own coinage. The basic notion is that while prices overall may not have risen all that much, prices of necessities have risen much faster, and the result is that people feel squeezed by the economy even as CPI growth remains low.
In this post I’d like to more directly evaluate that notion, by constructing an index of necessary expenditure (INE).
The core idea here is this:
What would you continue to buy, in roughly the same amounts, even if it doubled in price, because you simply can’t do without it?
For example, this is clearly true of housing: You can rent or you can own, but can’t not have a house. And nor are most families going to buy multiple houses—and they can’t buy partial houses.
It’s also true of healthcare: You need whatever healthcare you need. Yes, depending on your conditions, you maybe could go without, but not without suffering, potentially greatly. Nor are you going to go out and buy a bunch of extra healthcare just because it’s cheap. You need what you need.
I think it’s largely true of education as well: You want your kids to go to college. If college gets more expensive, you might—of necessity—send them to a worse school or not allow them to complete their degree, but this would feel like a great hardship for your family. And in today’s economy you can’t not send your kids to college.
But this is not true of technology: While there is a case to be made that in today’s society you need a laptop in the house, the fact is that people didn’t used to have those not that long ago, and if they suddenly got a lot cheaper you very well might buy another one.
Well, it just so happens that housing, healthcare, and education have all gotten radically more expensive over time, while technology has gotten radically cheaper. So prima facie, this is looking pretty plausible.
But I wanted to get more precise about it. So here is the index I have constructed. I consider a family of four, two adults, two kids, making the median household income.
To get the median income, I’ll use this FRED series for median household income, then use this table of median federal tax burden to get an after-tax wage. (State taxes vary too much for me to usefully include them.) Since the tax table ends in 2020 which was anomalous, I’m going to extrapolate that 2021-2024 should be about the same as 2019.
I assume the kids go to public school, but the parents are saving up for college; to make the math simple, I’ll assume the family is saving enough for each kid to graduate from with a four-year degree from a public university, and that saving is spread over 16 years of the child’s life. 2*4/16 = 0.5; this means that each year the family needs to come up with 0.5 years of cost of attendance. (I had to get the last few years from here, but the numbers are comparable.)
I assume the family owns two cars—both working full time, they kinda have to—which I amortize over 10 year lifetimes; 2*1/10 = 0.2, so each year the family pays 0.2 times the value of an average midsize car. (The current average new car price is $33226; I then use the CPI for cars to figure out what it was in previous years.)
I assume they pay a 30-year mortgage on the median home; they would pay interest on this mortgage, so I need to factor that in. I’ll assume they pay the average mortgage rate in that year, but I don’t want to have to do a full mortgage calculation (including PMI, points, down payment etc.) for each year, so I’ll say that they amount they pay is (1/30 + 0.5 (interest rate))*(home value) per year, which seems to be a reasonable approximation over the relevant range.
I assume that both adults have a 15-mile commute (this seems roughly commensurate with the current mean commute time of 26 minutes), both adults work 5 days per week, 50 weeks per year, and their cars get the median level of gas mileage. This means that they consume 2*15*2*5*50/(median MPG) = 15000/(median MPG) gallons of gasoline per year. I’ll use this BTS data for gas mileage. I’m intentionally not using median gasoline consumption, because when gas is cheap, people might take more road trips, which is consumption that could be avoided without great hardship when gas gets expensive. I will also assume that the kids take the bus to school, so that doesn’t contribute to the gasoline cost.
That I will multiply by the average price of gasoline in June of that year, which I have from the EIA since 1993. (I’ll extrapolate 1990-1992 as the same as 1993, which is conservative.)
I will assume that the family owns 2 cell phones, 1 computer, and 1 television. This is tricky, because the quality of these tech items has dramatically increased over time.
If you try to measure with equivalent buying power (e.g. a 1 MHz computer, a 20-inch CRT TV), then you’ll find that these items have gotten radically cheaper; $1000 in 1950 would only buy as much TV as $7 today, and a $50 Raspberry Pi‘s 2.4 GHz processor is 150 times faster than the 16 MHz offered by an Apple Powerbook in 1991—despite the latter selling for $2500 nominally. So in dollars per gigahertz, the price of computers has fallen by an astonishing 7,500 times just since 1990.
But I think that’s an unrealistic comparison. The standards for what was considered necessary have also increased over time. I actually think it’s quite fair to assume that people have spent a roughly constant nominal amount on these items: about $500 for a TV, $1000 for a computer, and $500 for a cell phone. I’ll also assume that the TV and phones are good for 5 years while the computer is good for 2 years, which makes the total annual expenditure for 2 phones, a TV, and a computer equal to 2/5*500 + 1/5*500 + 1/2*1000 = 800. This is about what a family must spend every year to feel like they have an adequate amount of digital technology.
I will assume that the family buys the equivalent of five months of infant care per year; they surely spend more than this (in either time or money) when they have actual infants, but less as the kids grow. This amounts to about $5000 today, but was only $1600 in 1990—a 214% increase, or 3.42% per year.
For food expenditure, I’m going to use the USDA’s thrifty plan for June of that year. I’ll use the figures assuming that one child is 6 and the other is 9. I don’t have data before 1994, so I’ll extrapolate that with the average growth rate of 3.2%.
The figures I had the hardest time getting were for utilities. It’s also difficult to know what to include: Is Internet access a necessity? Probably, nowadays—but not in 1990. Should I separate electric and natural gas, even though they are partial substitutes? But using these figures I estimate that utility costs rise at about 0.8% per year in CPI-adjusted terms, so what I’ll do is benchmark to $3800 in 2016 and assume that utility costs have risen by (0.8% + inflation rate) per year each year.
Healthcare is also a tough one; pardon the heteronormativity, but for simplicity I’m going to use the mean personal healthcare expenditures for one man and woman (aged 19-44) and one boy and one girl (aged 0-18). Unfortunately I was only able to find that for two-year intervals in the range from 2002 to 2020, so I interpolated and extrapolated both directions assuming the same average growth rate of 3.5%.
So let’s summarize what all is included here:
Estimated payment on a mortgage
0.5 years of college tuition
amortized cost of 2 cars
7500/(median MPG) gallons of gasoline
amortized cost of 2 phones, 1 computer, and 1 television
average spending on clothes
11% of income on food
Estimated utilities spending
Estimated childcare equivalent to five months of infant care
Healthcare for one man, one woman, one boy, one girl
There are obviously many criticisms you could make of these choices. If I were writing a proper paper, I would search harder for better data and run robustness checks over the various estimation and extrapolation assumptions. But for these purposes I really just want a ballpark figure, something that will give me a sense of what rising cost of living feels like to most people.
What I found absolutely floored me. Over the range from 1990 to 2024:
The Index of Necessary Expenditure rose by an average of 3.45% per year, almost a full percentage point higher than the average CPI inflation of 2.62% per year.
Over the same period, after-tax income rose at a rate of 3.31%, faster than CPI inflation, but slightly slower than the growth rate of INE.
The Index of Necessary Expenditure was over 100% of median after-tax household income every year except 2020.
Since 2021, the Index of Necessary Expenditure has risen at an average rate of 5.74%, compared to CPI inflation of only 2.66%. In that same time, after-tax income has only grown at a rate of 4.94%.
Point 3 is the one that really stunned me. The only time in the last 34 years that a family of four has been able to actually pay for all necessities—just necessities—on a typical household income was during the COVID pandemic, and that in turn was only because the federal tax burden had been radically reduced in response to the crisis. This means that every single year, a typical American family has been either going further and further into debt, or scrimping on something really important—like healthcare or education.
No wonder people feel like the economy is failing them! It is!
In fact, I can even make sense now of how Trump could convince people with “Are you better off than you were four years ago?” in 2024 looking back at 2020—while the pandemic was horrific and the disruption to the economy was massive, thanks to the US government finally actually being generous to its citizens for once, people could just about actually make ends meet. That one year. In my entire life.
This is why people felt betrayed by Biden’s economy. For the first time most of us could remember, we actually had this brief moment when we could pay for everything we needed and still have money left over. And then, when things went back to “normal”, it was taken away from us. We were back to no longer making ends meet.
When I went into this, I expected to see that the INE had risen faster than both inflation and income, which was indeed the case. But I expected to find that INE was a large but manageable proportion of household income—maybe 70% or 80%—and slowly growing. Instead, I found that INE was greater than 100% of income in every year but one.
And the truth is, I’m not sure I’ve adequately covered all necessary spending! My figures for childcare and utilities are the most uncertain; those could easily go up or down by quite a bit. But even if I exclude them completely, the reduced INE is still greater than income in most years.
Suddenly the way people feel about the economy makes a lot more sense to me.
We are of two minds about housing in our society. On the one hand, we recognize that shelter is a necessity, and we want it to be affordable for all. On the other hand, we see real estate as an asset, and we want it to appreciate in value and thereby provide a store of wealth. So on the one hand we want it to be cheap, but on the other hand we want it to be expensive. And of course it can’t be both.
This is not a uniquely American phenomenon. As Noah Smith points out, it seems to be how things are done in almost every country in the world. It may be foolish for me to try to turn such a tide. But I’m going to try anyway.
Housing should be cheap.
For some reason, inflation is seen as a bad thing for every other good, necessity and luxury alike; but when it comes to housing in particular—the single biggest expense for almost everyone—suddenly we are conflicted about it, and think that maybe inflation is a good thing actually.
This is because owning a home that appreciates in value provides the illusion of increasing wealth.
Yes, I said illusion. In some particular circumstances it can sometimes increase real wealth, but when housing is getting more expensive everywhere at once (which is basically true), it doesn’t actually increase real wealth—because you still need to have a home. So while you’d get more money if you sold your current home, you’d have to go buy another home that would be just as expensive. That extra wealth is largely imaginary.
In fact, what isn’t an illusion is your increased property tax bill. If you aren’t planning on selling your home any time soon, you should really see its appreciation as a bad thing; now you suddenly owe more in taxes.
Home equity lines of credit complicate this a bit; for some reason we let people collateralize part of the home—even though the whole home is already collateralized with a mortgage to someone else—and thereby turn that largely-imaginary wealth into actual liquid cash. This is just one more way that our financial system is broken; we shouldn’t be offering these lines of credit, just as we shouldn’t be creating mortgage-backed securities. Cleverness is not a virtue in finance; banking should be boring.
But you’re probably still not convinced. So I’d like you to consider a simple thought experiment, where we take either view to the extreme: Make housing 100 times cheaper or 100 times more expensive.
In Cheap World, there is no homelessness. Seriously, zero. It would make no sense at all for the government not to simply buy everyone a house. If you want to also buy your own house—or a dozen—go ahead, that’s fine; but you get one for free, paid for by tax dollars, because that’s cheaper than a year of schooling for a high-school student; it’s in fact not much more than what we’d currently spend to house someone in a homeless shelter for a year. So given the choice of offering someone two years at a shelter versus never homeless ever again, it’s pretty obvious we should choose the latter. Thus, in Cheap World, we all have a roof over our heads. And instead of storing their wealth in their homes in Cheap World, people store their wealth in stocks and bonds, which have better returns anyway.
In Expensive World, the top 1% are multi-millionaires who own homes, maybe the top 10% can afford rent, and the remaining 89% of the population are homeless. There’s simply no way to allocate the wealth of our society such that a typical middle class household has $40 million. We’re just not that rich. We probably never will be that rich. It may not even be possible to make a society that rich. In Expensive World, most people live in tents on the streets, because housing has been priced out of reach for all but the richest families.
Cheap World sounds like an amazing place to live. Expensive World is a horrific dystopia. The only thing I changed was the price of housing.
Yes, I changed it a lot; but that was to make the example as clear as possible, and it’s not even as extreme as it probably sounds. At 10% annual growth, 100 times more expensive only takes 49 years. At the current growth rate of housing prices of about 5% per year, it would take 95 years. A century from now, if we don’t fix our housing market, we will live in Expensive World. (Yes, we’ll most likely be richer then too; but will we be that much richer? Median income has not been rising nearly as fast as median housing price. If current trends continue, median income will be 5 times bigger and housing prices will be 100 times bigger—that’s still terrible.)
I think part of the problem is that people don’t really understand what wealth is. They see the number go up, and they think that means there is more wealth. Real wealth consists in goods, not in prices. The wealth we have is made of real things, not monetary prices. Prices merely decide how wealth is allocated.
A home is wealth, yes. But it’s the same amount of real wealth regardless of what price it has, because what matters is what it’s good for. If you become genuinely richer by selling an appreciated home, you gained that extra wealth from somewhere else; it was not contained within your home. You have appropriated wealth that someone else used to have. You haven’t created wealth; you’ve merely obtained it.
For you as an individual, that may not make a difference; you still get richer. But as a society, it makes all the difference: Moving wealth around doesn’t make our society richer, and all higher prices can do is move wealth around.
This means that rising housing prices simply cannot make our whole society richer. Better houses could do that. More houses could do that. But simply raising the price tag isn’t making our society richer. If it makes anyone richer—which, again, typically it does not—it does so by moving wealth from somewhere else. And since homeowners are generally richer than non-homeowners (even aside from their housing wealth!), more expensive homes means moving wealth from poorer people to richer people—increased inequality.
We used to have affordable housing, just a couple of generations ago. But we may never have truly affordable housing again, because people really don’t like to see that number go down, and they vote for policies accordingly—especially at the local level. Our best hope right now seems to be to keep it from going up faster than the growth rate of income, so that homes don’t become any more unaffordable than they already are.
But frankly I’m not optimistic. I think part of the cyberpunk dystopia we’re careening towards is Expensive World.
There has been unusually high inflation the past few years, mostly attributable to the COVID pandemic and its aftermath. But groceries in particular seem to have gotten especially more expensive. We’ve all felt it: Eggs, milk, and toilet paper especially soared to extreme prices and then, even when they came back down, never came down all the way.
Why would this be?
Did it involve supply chain disruptions? Sure. Was it related to the war in Ukraine? Probably.
But it clearly wasn’t just those things—because, as the FTC recently found, grocery stores have been colluding and price-gouging. Large grocery chains like Walmart and Kroger have a lot of market power, and they used that power to raise prices considerably faster than was necessary to keep up with their increased costs; as a result, they made record profits. Their costs did genuinely increase, but they increased their prices even more, and ended up being better off.
The big chains were also better able to protect their own supply chains than smaller companies, and so the effects of the pandemic further entrenched the market power of a handful of corporations. Some of them also imposed strict delivery requirements on their suppliers, pressuring them to prioritize the big companies over the small ones.
This kind of thing is what happens when we let oligopolies take control. When only a few companies control the market, prices go up, quality goes down, and inequality gets worse.
For far too long, institutions like the FTC have failed to challenge the ever tighter concentration of our markets in the hands of a small number of huge corporations.
And most of these lists used to be longer. Disney recently acquired 21st Century Fox. Viacom recently merged with CBS and then became Paramount. Universal recently acquired EMI. Our markets aren’t simply alarmingly concentrated; they have also been getting more concentrated over time.
Institutions like the FTC are supposed to be protecting us from oligopolies, by ensuring that corporations can’t merge and acquire each other once they reach a certain market share. But decades of underfunding and laissez-faire ideology have weakened these institutions. So many mergers that obviously shouldn’t have been allowed were allowed, because no regulatory agency had the will and the strength to stop them.
Hopefully this is a sign that the FTC has found its teeth again, and will continue to prosecute anti-trust cases against oligopolies. A lot of that may depend on who ends up in the White House this November.
We are living in a very weird time, economically. The COVID pandemic created huge disruptions throughout our economy, from retail shops closing to shortages in shipping containers. The result was a severe recession with the worst unemployment since the Great Depression.
Now, a few years later, we have fully recovered.
Here’s a graph from FRED showing our unemployment and inflation rates since 1990 [technical note: I’m using the urban CPI; there are a few other inflation measures you could use instead, but they look much the same]:
Inflation fluctuates pretty quickly, while unemployment moves much slower.
There are a lot of things we can learn from this graph:
Before COVID, we had pretty low inflation; from 1990 to 2019, inflation averaged about 2.4%, just over the Fed’s 2% target.
Before COVID, we had moderate to high unemployment; it rarely went below 5% and and for several years after the 2008 crash it was over 7%—which is why we called it the Great Recession.
The only times we actually had negative inflation—deflation—were during recessions, and coincided with high unemployment; so, no, we really don’t want prices to come down.
During COVID, we had a massive spike in unemployment up to almost 15%, but then it came back down much more rapidly than it had in the Great Recession.
After COVID, there was a surge in inflation, peaking at almost 10%.
That inflation surge was short-lived; by the end of 2022 inflation was back down to 4%.
Unemployment now stands at 3.8% while inflation is at 2.7%.
What I really want to emphasize right now is point 7, so let me repeat it:
Unemployment now stands at 3.8% while inflation is at 2.7%.
Yes, technically, 2.7% is above our inflation target. But honestly, I’m not sure it should be. I don’t see any particular reason to think that 2% is optimal, and based on what we’ve learned from the Great Recession, I actually think 3% or even 4% would be perfectly reasonable inflation targets. No, we don’t want to be going into double-digits (and we certainly don’t want true hyperinflation); but 4% inflation really isn’t a disaster, and we should stop treating it like it is.
2.7% inflation is actually pretty close to the 2.4% inflation we’d been averaging from 1990 to 2019. So I think it’s fair to say that inflation is back to normal.
But the really wild thing is that unemployment isn’t back to normal: It’s much better than that.
To get some more perspective on this, let’s extend our graph backward all the way to 1950:
Inflation has been much higher than it is now. In the late 1970s, it was consistently as high as it got during the post-COVID surge. But it has never been substantially lower than it is now; a little above the 2% target really seems to be what stable, normal inflation looks like in the United States.
On the other hand, unemployment is almost never this low. It was for a few years in the early 1950s and the late 1960s; but otherwise, it has always been higher—and sometimes much higher. It did not dip below 5% for the entire period from 1971 to 1994.
They hammer into us in our intro macroeconomics courses the Phillips Curve, which supposedly says that unemployment is inversely related to inflation, so that it’s impossible to have both low inflation and low unemployment.
But we’re looking at it, right now. It’s here, right in front of us. What wasn’t supposed to be possible has now been achieved. E pur si muove.
There was supposed to be this terrible trade-off between inflation and unemployment, leaving our government with the stark dilemma of either letting prices surge or letting millions remain out of work. I had always been on the “inflation” side: I thought that rising prices were far less of a problem than poeple out of work.
But we just learned that the entire premise was wrong.
You can have both. You don’t have to choose.
Right here, right now, we have both. All we need to do is keep doing whatever we’re doing.
One response might be: what if we can’t? What if this is unsustainable? (Then again, conservatives never seemed terribly concerned about sustainability before….)
It’s worth considering. One thing that doesn’t look so great now is the federal deficit. It got extremely high during COVID, and it’s still pretty high now. But as a proportion of GDP, it isn’t anywhere near as high as it was during WW2, and we certainly made it through that all right:
So, yeah, we should probably see if we can bring the budget back to balanced—probably by raising taxes. But this isn’t an urgent problem. We have time to sort it out. 15% unemployment was an urgent problem—and we fixed it.
In fact in some ways the economy is even doing better now than it looks. Unemployment for Black people has never been this low, since we’ve been keeping track of it:
Black people had basically learned to live with 8% or 9% unemployment as if it were normal; but now, for the first time ever—ever—their unemployment rate is down to only 5%.
This isn’t because people are dropping out of the labor force. Broad unemployment,which includes people marginally attached to the labor force, people employed part-time not by choice, and people who gave up looking for work, is also at historic lows, despite surging to almost 23% during COVID:
In fact, overall employment among people 25-54 years old (considered “prime age”—old enough to not be students, young enough to not be retired) is nearly the highest it has ever been, and radically higher than it was before the 1980s (because women entered the workforce):
So this is not an illusion: More Americans really are working now. And employment has become more inclusive of women and minorities.
I really don’t understand why President Biden isn’t more popular. Biden inherited the worst unemployment since the Great Depression, and turned it around into an economic situation so good that most economists thought it was impossible. A 39% approval rating does not seem consistent with that kind of staggering economic improvement.
And yes, there are a lot of other factors involved aside from the President; but for once I think he really does deserve a lot of the credit here. Programs he enacted to respond to COVID brought us back to work quicker than many thought possible. Then, the Inflation Reduction Act made historic progress at fighting climate change—and also, lo and behold, reduced inflation.
He’s not a particularly charismatic figure. He is getting pretty old for this job (or any job, really). But Biden’s economic policy has been amazing, and deserves more credit for that.
I’m glad to see that the Biden administration is finally talking about “Bidenomics”. We tend to give too much credit or blame for economic performance to the President—particularly relative to Congress—but there are many important ways in which a Presidential administration can shift the priorities of public policy in particular directions, and Biden has clearly done that.
The economic benefits for people of color seem to have been particularly large. The unemployment gap between White and Black workers in the US is now only 2.7 percentage points, while just a few years ago it was over 4pp and at the worst of the Great Recession it surpassed 7pp. During lockdown, unemployment for Black people hit nearly 17%; it is now less than 6%.
The (misnamed, but we’re stuck with it) Inflation Reduction Act in particular has been an utter triumph.
In the past year, real private investment in manufacturing structures (essentially, new factories) has risen from $56 billion to $87 billion—an over 50% increase, which puts it the highest it has been since the turn of the century. The Inflation Reduction Act appears to be largely responsible for this change.
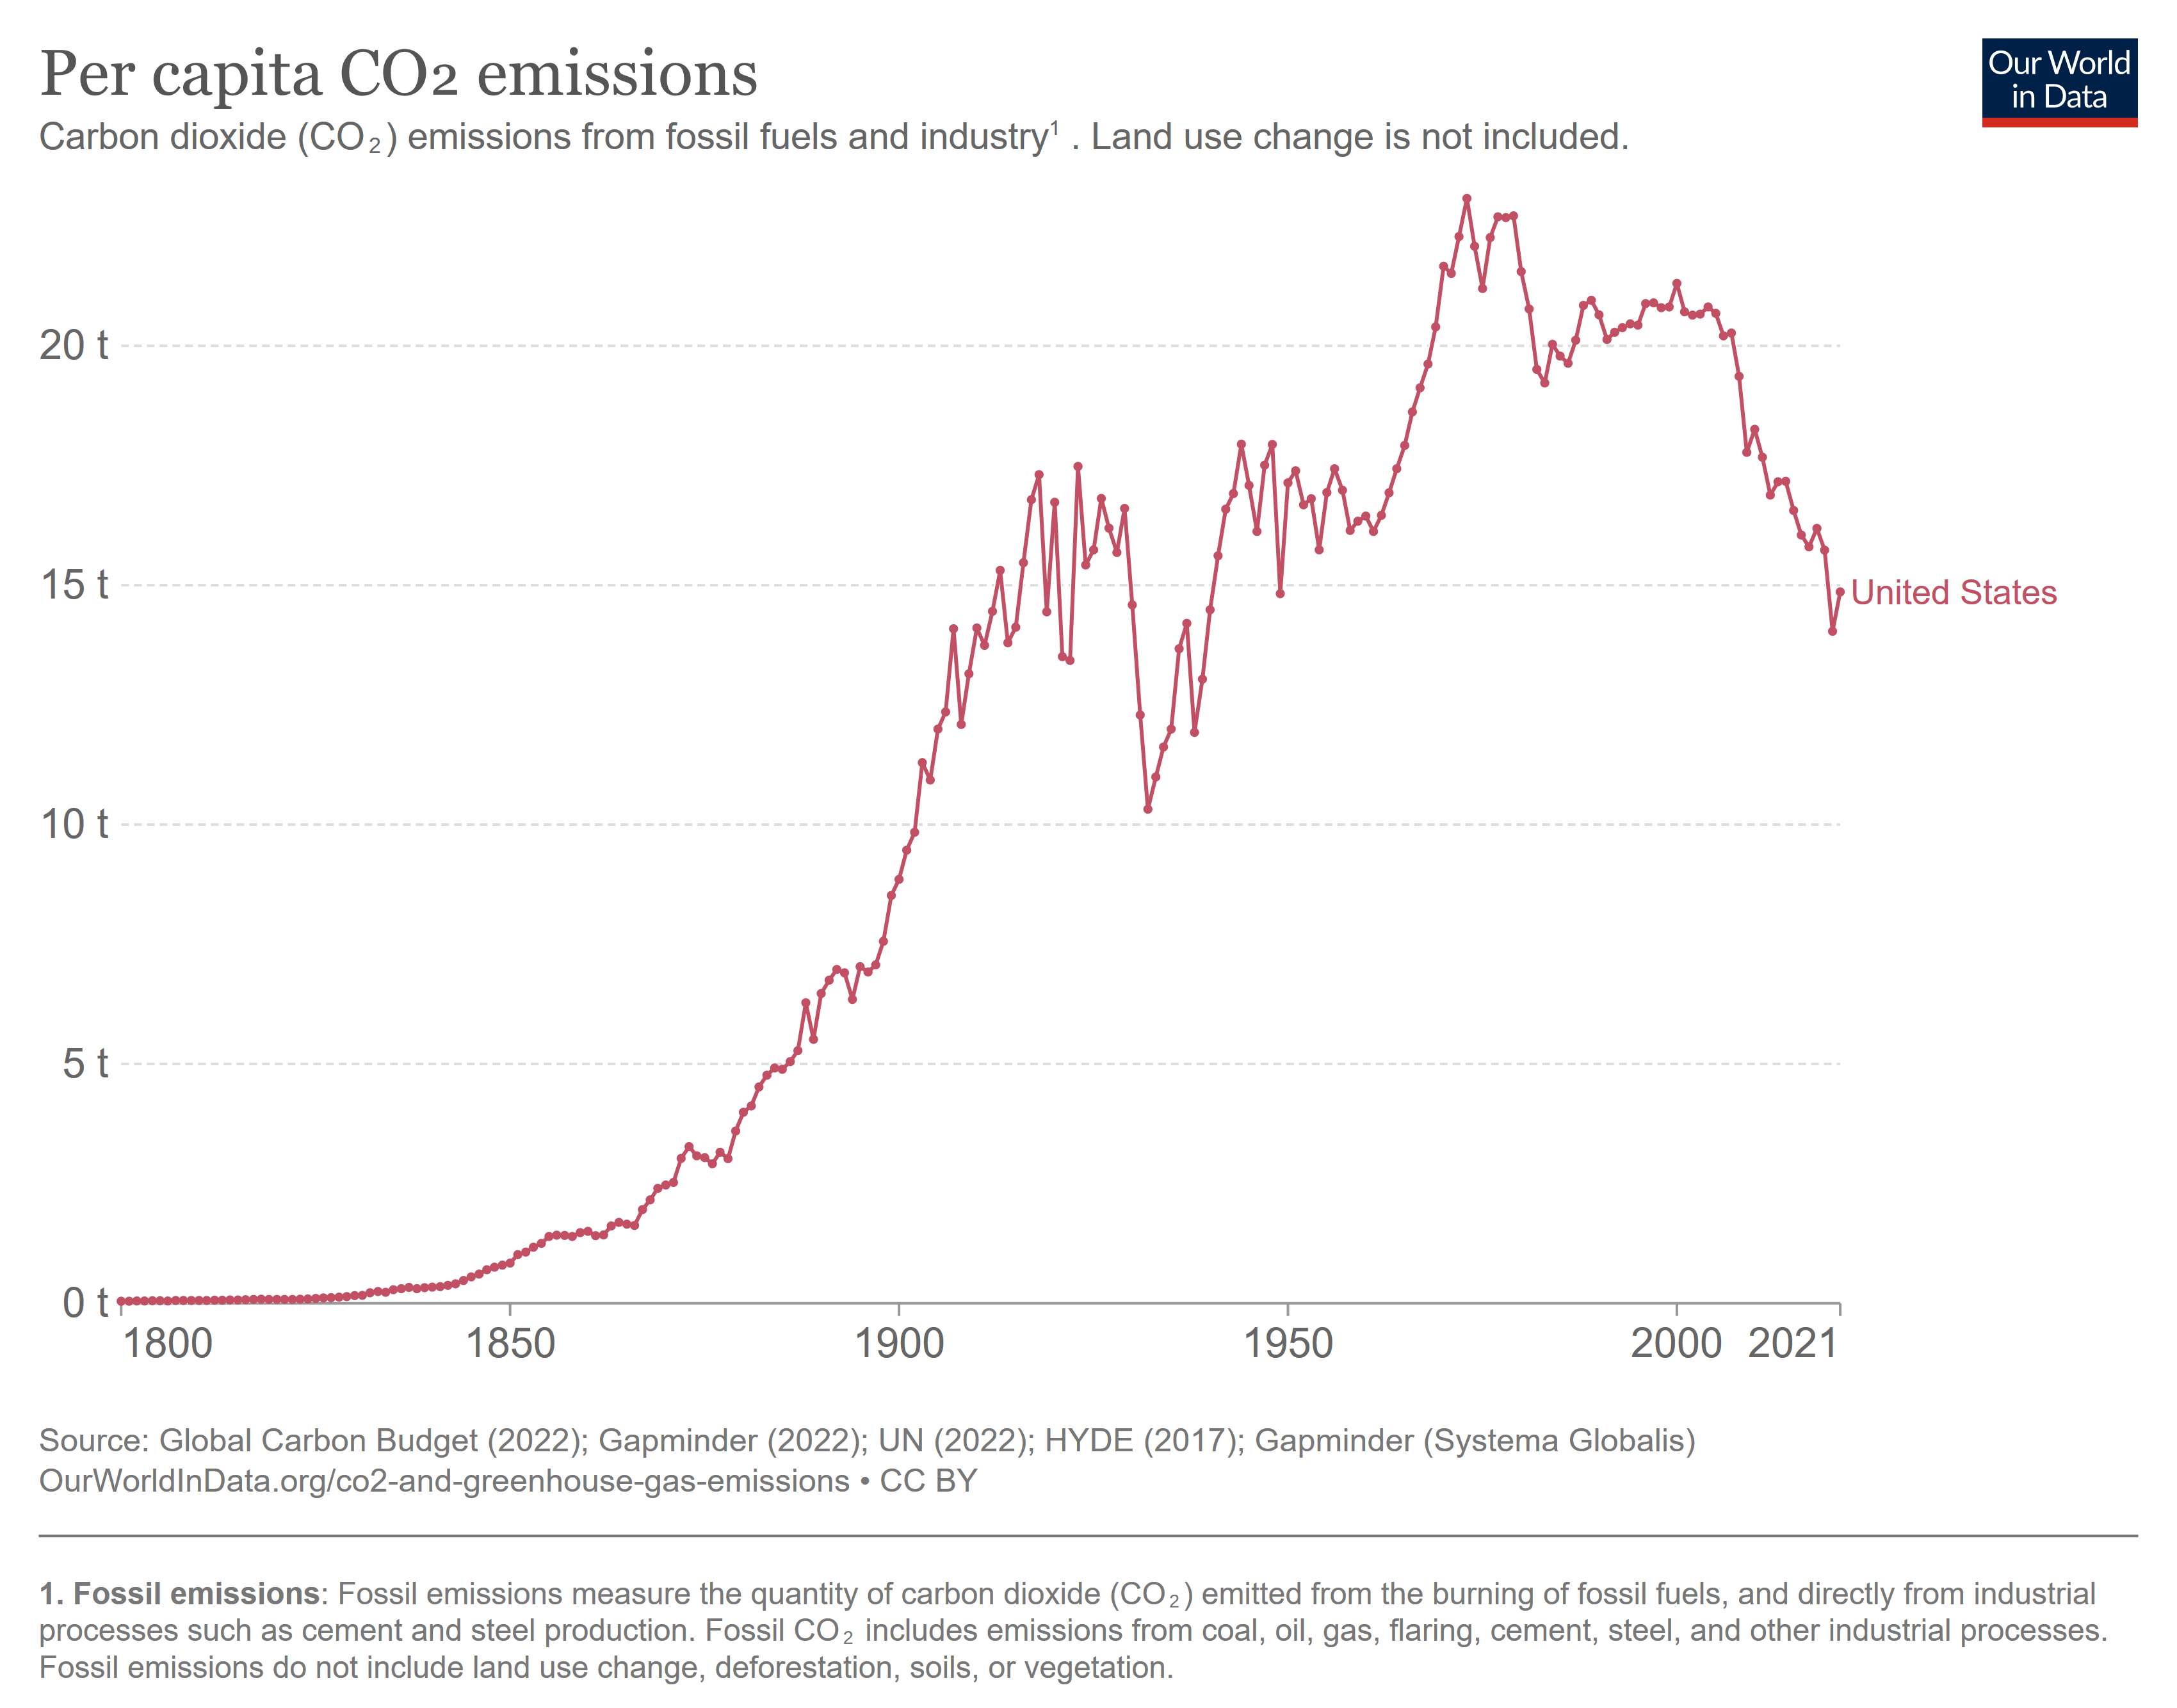
Not many people seem to know this, but the US has also been on the right track with regard to carbon emissions: Per-capita carbon emissions in the US have been trending downward since about 2000, and are now lower than they were in the 1950s. The Inflation Reduction act now looks poised to double down on that progress, as it has been forecasted to reduce our emissions all the way down to 40% below their early-2000s peak.
Most Americans do correctly believe that inflation is still a bit high (though many seem to think it’s higher than it is); this is weird, seeing as inflation is normally high when the economy is growing rapidly, and gets too low when we are in a recession. This seems to be Halo Effect, rather than any genuine understanding of macroeconomics: downturns are bad and inflation is bad, so they must go together—when in fact, quite the opposite is the case.
Sixty-four percent of Americans say the economy is worse off compared to 2020, while seventy-three percent of Americans say the economy is worse off compared to five years ago. About two in five of Americans say they feel worse off from five years ago generally (38%) and a similar number say they feel worse off compared to 2020 (37%).
(Did you really have to write out ‘seventy-three percent’? I hate that convention. 73% is so much clearer and quicker to read.)
I don’t know what the Biden administration should do about this. Trying to sell themselves harder might backfire. (And I’m pretty much the last person in the world you should ask for advice about selling yourself.) But they’ve been doing really great work for the US economy… and people haven’t noticed. Thousands of factories are being built, millions of people are getting jobs, and the collective response has been… “meh”.
I wasn’t able to find a dictionary that includes the word “statisticacy”, but it doesn’t trigger my spell-check, and it does seem to have the same form as “numeracy”: numeric, numerical, numeracy, numerate; statistic, statistical, statisticacy, statisticate. It definitely still sounds very odd to my ears. Perhaps repetition will eventually make it familiar.
For the concept is clearly a very important one. Literacy and numeracy are no longer a serious problem in the First World; basically every adult at this point knows how to read and do addition. Even worldwide, 90% of men and 83% of women can read, at least at a basic level—which is an astonishing feat of our civilization by the way, well worthy of celebration.
But I have noticed a disturbing lack of, well, statisticacy. Even intelligent, educated people seem… pretty bad at understanding statistics.
I’m not talking about sophisticated econometrics here; of course most people don’t know that, and don’t need to. (Most economists don’t know that!) I mean quite basic statistical knowledge.
As part of being a good citizen in a modern society, every adult should understand the following:
1. The difference between a mean and a median, and why average income (mean) can increase even though most people are no richer (median).
2. The difference between increasing by X% and increasing by X percentage points: If inflation goes from 4% to 5%, that is an increase of 20% ((5/4-1)*100%), but only 1 percentage point (5%-4%).
3. The meaning of standard error, and how to interpret error bars on a graph—and why it’s a huge red flag if there aren’t any error bars on a graph.
4. Basic probabilistic reasoning: Given some scratch paper, a pen, and a calculator, everyone should be able to work out the odds of drawing a given blackjack hand, or rolling a particular number on a pair of dice. (If that’s too easy, make it a poker hand and four dice. But mostly that’s just more calculation effort, not fundamentally different.)
5. The meaning of exponential growth rates, and how they apply to economic growth and compound interest. (The difference between 3% interest and 6% interest over 30 years is more than double the total amount paid.)
I see people making errors about this sort of thing all the time.
Economic news that celebrates rising GDP but wonders why people aren’t happier (when real median income has been falling since 2019 and is only 7% higher than it was in 1999, an annual growth rate of 0.2%).
Reports on inflation, interest rates, or poll numbers that don’t clearly specify whether they are dealing with percentages or percentage points. (XKCD made fun of this.)
Speaking of poll numbers, any reporting on changes in polls that isn’t at least twice the margin of error of the polls in question. (There’s also a comic for this; this time it’s PhD Comics.)
And, perhaps worst of all, the plague of science news articles about “New study says X”. Things causing and/or cancer, things correlated with personality types, tiny psychological nudges that supposedly have profound effects on behavior.
Some of these things will even turn out to be true; actually I think this one on fibromyalgia, this one on smoking, and this one on body image are probably accurate. But even if it’s a properly randomized experiment—and especially if it’s just a regression analysis—a single study ultimately tells us very little, and it’s irresponsible to report on them instead of telling people the extensive body of established scientific knowledge that most people still aren’t aware of.
Basically any time an article is published saying “New study says X”, a statisticate person should ignore it and treat it as random noise. This is especially true if the finding seems weird or shocking; such findings are far more likely to be random flukes than genuine discoveries. Yes, they could be true, but one study just doesn’t move the needle that much.
I don’t remember where it came from, but there is a saying about this: “What is in the textbooks is 90% true. What is in the published literature is 50% true. What is in the press releases is 90% false.” These figures are approximately correct.
If their goal is to advance public knowledge of science, science journalists would accomplish a lot more if they just opened to a random page in a mainstream science textbook and started reading it on air. Admittedly, I can see how that would be less interesting to watch; but then, their job should be to find a way to make it interesting, not to take individual studies out of context and hype them up far beyond what they deserve. (Bill Nye did this much better than most science journalists.)
I’m not sure how much to blame people for lacking this knowledge. On the one hand, they could easily look it up on Wikipedia, and apparently choose not to. On the other hand, they probably don’t even realize how important it is, and were never properly taught it in school even though they should have been. Many of these things may even be unknown unknowns; people simply don’t realize how poorly they understand. Maybe the most useful thing we could do right now is simply point out to people that these things are important, and if they don’t understand them, they should get on that Wikipedia binge as soon as possible.
And one last thing: Maybe this is asking too much, but I think that a truly statisticate person should be able to solve the Monty Hall Problem and not be confused by the result. (Hint: It’s very important that Monty Hall knows which door the car is behind, and would never open that one. If he’s guessing at random and simply happens to pick a goat, the correct answer is 1/2, not 2/3. Then again, it’s never a bad choice to switch.)
A lot of people seem really upset about inflation. I’ve previously discussed why this is a bit weird; inflation really just isn’t that bad. In fact, I am increasingly concerned that the usual methods for fixing inflation are considerably worse than inflation itself.
To be clear, I’m not talking about hyperinflation—if you are getting triple-digit inflation or more, you are clearly printing too much money and you need to stop. And there are places in the world where this happens.
But what about just regular, ordinary inflation, even when it’s fairly high? Prices rising at 8% or 9% or even 11% per year? What catastrophe befalls our society when this happens?
Okay, sure, if we could snap our fingers and make prices all stable without cost, that would be worth doing. But we can’t. All of our mechanisms for reducing inflation come with costs—and often very high costs.
The chief mechanism by which inflation is currently controlled is open-market operations by central banks such as the Federal Reserve, the Bank of England, and the European Central Bank. These central banks try to reduce inflation by selling bonds, which lowers the price of bonds and reduces capital available to banks, and thereby increases interest rates. This also effectively removes money from the economy, as banks are using that money to buy bonds instead of lending it out. (It is chiefly in this odd indirect sense that the central bank manages the “money supply”.)
But how does this actually reduce inflation? It’s remarkably indirect. It’s actually the higher interest rates which prevent people from buying houses and prevent companies from hiring workers which result in reduced economic growth—or even economic recession—which then is supposed to bring down prices. There’s actually a lot we still don’t know about how this works or how long it should be expected to take. What we do know is that the pain hits quickly and the benefits arise only months or even years later.
As Krugman has rightfully pointed out, the worst pain of the 1970s was not the double-digit inflation; it was the recessions that Paul Volcker’s economic policy triggered in response to that inflation. The inflation wasn’t exactly a good thing; but for most people, the cure was much worse than the disease.
Most laypeople seem to think that prices somehow go up without wages going up, but that simply isn’t how it works. Prices and wages rise at close to the same rate in most countries most of the time. In fact, inflation is often driven chiefly by rising wages rather than the other way around. There are often lags between when the inflation hits and when people see their wages rise; but these lags can actually be in either direction—inflation first or wages first—and for moderate amounts of inflation they are clearly less harmful than the high rates of unemployment that we would get if we fought inflation more aggressively with monetary policy.
Economists are also notoriously vague about exactly how they expect the central bank to reduce inflation. They use complex jargon or broad euphemisms. But when they do actually come out and say they want to reduce wages, it tends to outrage people. Well, that’s one of three main ways that interest rates actually reduce inflation: They reduce wages, they cause unemployment, or they stop people from buying houses. That’s pretty much all that central banks can do.
There may be other ways to reduce inflation, like windfall profits taxes, antitrust action, or even price controls. The first two are basically no-brainers; we should always be taxing windfall profits (if they really are due to a windfall outside a corporation’s control, there’s no incentive to distort), and we should absolutely be increasing antitrust action (why did we reduce it in the first place?). Price controls are riskier—they really do create shortages—but then again, is that really worse than lower wages or unemployment? Because the usual strategy involves lower wages and unemployment.
It’s a little ironic: The people who are usually all about laissez-faireare the ones who panic about inflation and want the government to take drastic action; meanwhile, I’m usually in favor of government intervention, but when it comes to moderate inflation, I think maybe we should just let it be.