Reflections on the Index of Necessary Expenditure

Mar 16 JDN 2460751

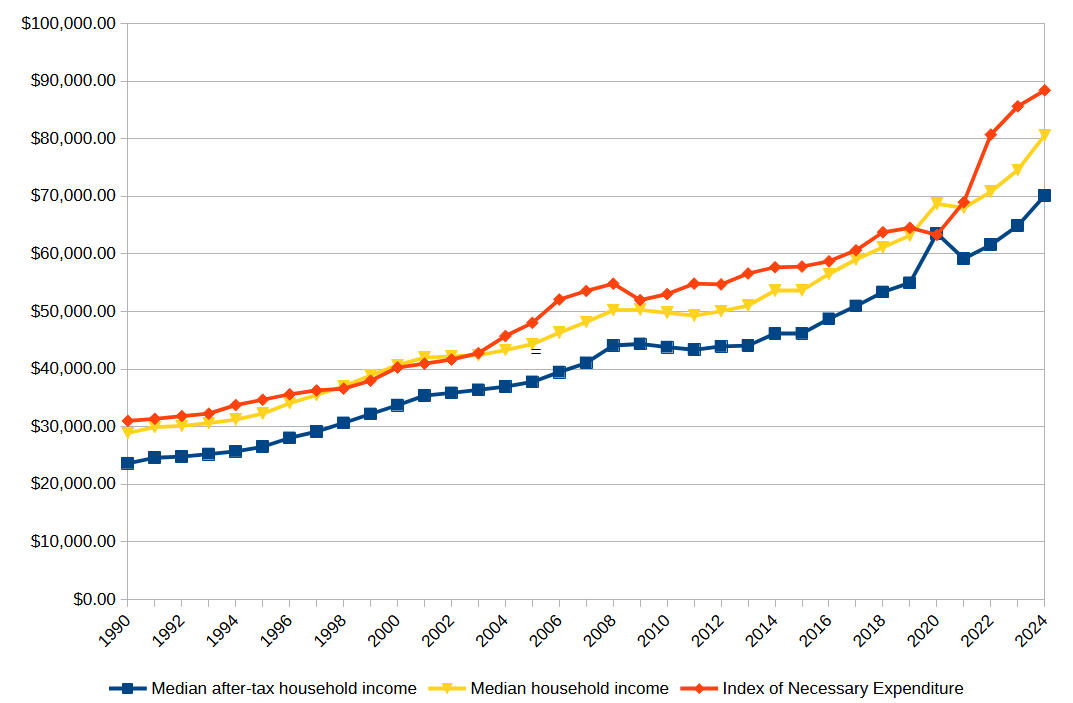
In last week’s post I constructed an Index of National Expenditure (INE), attempting to estimate the total cost of all of the things a family needs and can’t do without, like housing, food, clothing, cars, healthcare, and education. What I found shocked me: The median family cannot afford all necessary expenditures.

I have a couple more thoughts about that.

I still don’t understand why people care so much about gas prices.

Gasoline was a relatively small contribution to INE. It was more than clothing but less than utilities, and absolutely dwarfed by housing, food, or college. I thought maybe since I only counted a 15-mile commute, maybe I didn’t actually include enoughgasoline usage, but based on this estimate of about $2000 per driver, I was in about the right range; my estimate for the same year was $3350 for a 2-car family.

I think I still have to go with my salience hypothesis: Gasoline is the only price that we plaster in real-time on signs on the side of the road. So people are constantly aware of it, even though it isn’t actually that important.

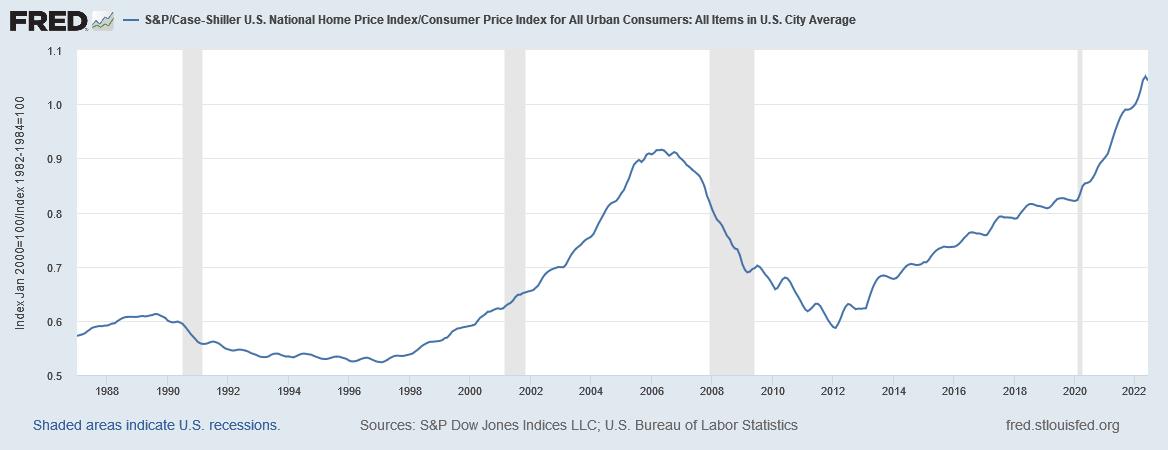
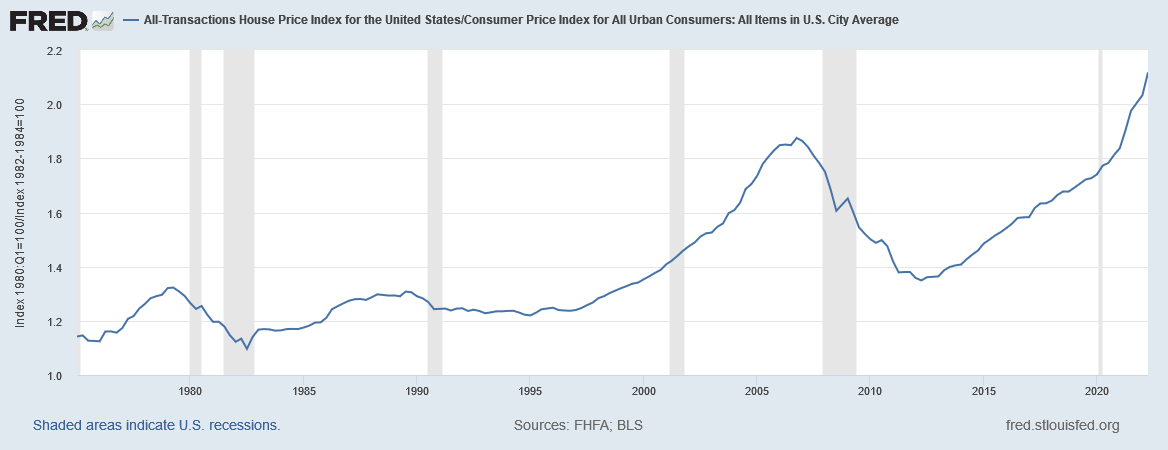
The price surge that should be upsetting people is housing.

If the price of homes had only risen with the rate of CPI inflation instead of what it actually did, the median home price in 2024 would be only $234,000 instead of the $396,000 it actually is; and by my estimation that would save a typical family $11,000 per year—a whopping 15% of their income, and nearly enough to make the INE affordable by itself.

Now, I’ll consider some possible objections to my findings.

Objection 1: A typical family doesn’t actually spend this much on these things.

You’re right, they don’t! Because they couldn’t possibly. Even with substantial debt, you just can’t sustainably spend 125% of your after-tax household income.

My goal here was not to estimate how much families actually spend; it was to estimate how much they need to spend in order to live a good life and not feel deprived.


What I have found is that most American families feel deprived. They are forced to sacrifice something really important—like healthcare, or education, or owning a home—because they simply can’t afford it.

What I’m trying to do here is find the price of the American Dream; and what I’ve found is that the American Dream has a price that most Americans cannot afford.

Objection 2: You should use median healthcare spending, not mean.

I did in fact use mean figures instead of median for healthcare expenditures, mainly because only the mean was readily available. Mean income is higher than median income, so you might say that I’ve overestimated healthcare expenditure—and in a sense that’s definitely true. The median family spends less than this on healthcare.

But the reason that the median family spends less than this on healthcare is not that they want to, but that they have to. Healthcare isn’t a luxury that people buy more of because they are richer. People buy either as much as they need or as much as they can afford—whichever is lower, which is typically the latter. Using the mean instead of the median is a crude way to account for that, but I think it’s a defensible one.

But okay, let’s go ahead and cut the estimate of healthcare spending in half; even if you do that, the INE is still larger than after-tax median household income in most years.

Objection 3: A typical family isn’t a family of four, it’s a family of three.

Yes, the mean number of people in a family household in the US is 3.22 (the median is 3).

This is a very bad thing.

Part of what I seem to be finding here is that a family of four is unaffordable—literally impossible to afford—on a typical family income.

But a healthy society is one in which typical families have two or three children. That is what we need in order to achieve population replacement. When families get smaller than that, we aren’t having enough children, and our population will decline—which means that we’ll have too many old people relative to young people. This puts enormous pressure on healthcare and pension systems, which rely upon the fact that young people produce more, in order to pay for the fact that old people cost more.

The ideal average number of births per woman is about 2.1; this is what would give us a steady population. No US state has fertility above this level. The only reason the US population is growing rather than shrinking is that we are taking in immigrants.

This is bad. This is not sustainable. If the reason families aren’t having enough kids is that they can’t afford them—and this fits with other research on the subject—then this economic failure damages our entire society, and it needs to be fixed.

Objection 4: Many families buy their cars used.

Perhaps 1/10 of a new car every year isn’t an ideal estimate of how much people spend on their cars, but if anything I think it’s conservative, because if you only buy a car every 10 years, and it was already used when you bought it, you’re going to need to spend a lot on maintaining it—quite possibly more than it would cost to get a new one. Motley Fool actually estimates the ownership cost of just one car at substantially more than I estimated for two cars. So if anything your complaint should be that I’ve underestimated the cost by not adequately including maintenance and insurance.

Objection 5: Not everyone gets a four-year college degree.

Fair enough; a substantial proportion get associate’s degrees, and most people get no college degree at all. But some also get graduate degrees, which is even more expensive (ask me how I know).

Moreover, in today’s labor market, having a college degree makes a huge difference in your future earnings; a bachelor’s degree increases your lifetime earnings by a whopping 84%. In theory it’s okay to have a society where most people don’t go to college; in practice, in our society, not going to college puts you at a tremendous disadvantage for the rest of your life. So we either need to find a way to bring wages up for those who don’t go to college, or find a way to bring the cost of college down.

This is probably one of the things that families actually choose to scrimp on, only sending one kid to college or none at all. But because college is such a huge determinant of earnings, this perpetuates intergenerational inequality: Only rich families can afford to send their kids to college, and only kids who went to college grow up to have rich families.

Objection 6: You don’t actually need to save for college; you can use student loans.

Yes, you can, and in practice, most people who to college do. But while this solves the liquidity problem (having enough money right now), it does not solve the solvency problem (having enough money in the long run). Failing to save for college and relying on student loans just means pushing the cost of college onto your children—and since we’ve been doing that for over a generation, feel free to replace the category “college savings” with “repaying student loans”; it won’t meaningfully change the results.

The Index of Necessary Expenditure

Mar 16 JDN 2460751

I’m still reeling from the fact that Donald Trump was re-elected President. He seemed obviously horrible at the time, and he still seems horrible now, for many of the same reasons as before (we all knew the tariffs were coming, and I think deep down we knew he would sell out Ukraine because he loves Putin), as well as some brand new ones (I did not predict DOGE would gain access to all the government payment systems, nor that Trump would want to start a “crypto fund”). Kamala Harris was not an ideal candidate, but she was a good candidate, and the comparison between the two could not have been starker.

Now that the dust has cleared and we have good data on voting patterns, I am now less convinced than I was that racism and sexism were decisive against Harris. I think they probably hurt her some, but given that she actually lost the most ground among men of color, racism seems like it really couldn’t have been a big factor. Sexism seems more likely to be a significant factor, but the fact that Harris greatly underperformed Hillary Clinton among Latina women at least complicates that view.

A lot of voters insisted that they voted on “inflation” or “the economy”. Setting aside for a moment how absurd it was—even at the time—to think that Trump (he of the tariffs and mass deportations!) was going to do anything beneficial for the economy, I would like to better understand how people could be so insistent that the economy was bad even though standard statistical measures said it was doing fine.

Krugman believes it was a “vibecession”, where people thought the economy was bad even though it wasn’t. I think there may be some truth to this.


But today I’d like to evaluate another possibility, that what people were really reacting against was not inflation per se but necessitization.

I first wrote about necessitization in 2020; as far as I know, the term is my own coinage. The basic notion is that while prices overall may not have risen all that much, prices of necessities have risen much faster, and the result is that people feel squeezed by the economy even as CPI growth remains low.

In this post I’d like to more directly evaluate that notion, by constructing an index of necessary expenditure (INE).

The core idea here is this:

What would you continue to buy, in roughly the same amounts, even if it doubled in price, because you simply can’t do without it?

For example, this is clearly true of housing: You can rent or you can own, but can’t not have a house. And nor are most families going to buy multiple houses—and they can’t buy partial houses.

It’s also true of healthcare: You need whatever healthcare you need. Yes, depending on your conditions, you maybe could go without, but not without suffering, potentially greatly. Nor are you going to go out and buy a bunch of extra healthcare just because it’s cheap. You need what you need.

I think it’s largely true of education as well: You want your kids to go to college. If college gets more expensive, you might—of necessity—send them to a worse school or not allow them to complete their degree, but this would feel like a great hardship for your family. And in today’s economy you can’t not send your kids to college.

But this is not true of technology: While there is a case to be made that in today’s society you need a laptop in the house, the fact is that people didn’t used to have those not that long ago, and if they suddenly got a lot cheaper you very well might buy another one.

Well, it just so happens that housing, healthcare, and education have all gotten radically more expensive over time, while technology has gotten radically cheaper. So prima facie, this is looking pretty plausible.

But I wanted to get more precise about it. So here is the index I have constructed. I consider a family of four, two adults, two kids, making the median household income.

To get the median income, I’ll use this FRED series for median household income, then use this table of median federal tax burden to get an after-tax wage. (State taxes vary too much for me to usefully include them.) Since the tax table ends in 2020 which was anomalous, I’m going to extrapolate that 2021-2024 should be about the same as 2019.

I assume the kids go to public school, but the parents are saving up for college; to make the math simple, I’ll assume the family is saving enough for each kid to graduate from with a four-year degree from a public university, and that saving is spread over 16 years of the child’s life. 2*4/16 = 0.5; this means that each year the family needs to come up with 0.5 years of cost of attendance. (I had to get the last few years from here, but the numbers are comparable.)

I assume the family owns two cars—both working full time, they kinda have to—which I amortize over 10 year lifetimes; 2*1/10 = 0.2, so each year the family pays 0.2 times the value of an average midsize car. (The current average new car price is $33226; I then use the CPI for cars to figure out what it was in previous years.)

I assume they pay a 30-year mortgage on the median home; they would pay interest on this mortgage, so I need to factor that in. I’ll assume they pay the average mortgage rate in that year, but I don’t want to have to do a full mortgage calculation (including PMI, points, down payment etc.) for each year, so I’ll say that they amount they pay is (1/30 + 0.5 (interest rate))*(home value) per year, which seems to be a reasonable approximation over the relevant range.

I assume that both adults have a 15-mile commute (this seems roughly commensurate with the current mean commute time of 26 minutes), both adults work 5 days per week, 50 weeks per year, and their cars get the median level of gas mileage. This means that they consume 2*15*2*5*50/(median MPG) = 15000/(median MPG) gallons of gasoline per year. I’ll use this BTS data for gas mileage. I’m intentionally not using median gasoline consumption, because when gas is cheap, people might take more road trips, which is consumption that could be avoided without great hardship when gas gets expensive. I will also assume that the kids take the bus to school, so that doesn’t contribute to the gasoline cost.

That I will multiply by the average price of gasoline in June of that year, which I have from the EIA since 1993. (I’ll extrapolate 1990-1992 as the same as 1993, which is conservative.)

I will assume that the family owns 2 cell phones, 1 computer, and 1 television. This is tricky, because the quality of these tech items has dramatically increased over time.

If you try to measure with equivalent buying power (e.g. a 1 MHz computer, a 20-inch CRT TV), then you’ll find that these items have gotten radically cheaper; $1000 in 1950 would only buy as much TV as $7 today, and a $50 Raspberry Pi‘s 2.4 GHz processor is 150 times faster than the 16 MHz offered by an Apple Powerbook in 1991—despite the latter selling for $2500 nominally. So in dollars per gigahertz, the price of computers has fallen by an astonishing 7,500 times just since 1990.

But I think that’s an unrealistic comparison. The standards for what was considered necessary have also increased over time. I actually think it’s quite fair to assume that people have spent a roughly constant nominal amount on these items: about $500 for a TV, $1000 for a computer, and $500 for a cell phone. I’ll also assume that the TV and phones are good for 5 years while the computer is good for 2 years, which makes the total annual expenditure for 2 phones, a TV, and a computer equal to 2/5*500 + 1/5*500 + 1/2*1000 = 800. This is about what a family must spend every year to feel like they have an adequate amount of digital technology.

I will also assume that the family buys clothes with this equivalent purchasing power, with an index that goes from 166 in 1990 to 177 in 2024—also nearly constant in nominal terms. I’ll multiply that index by $10 because the average annual household spending on clothes is about $1700 today.

I will assume that the family buys the equivalent of five months of infant care per year; they surely spend more than this (in either time or money) when they have actual infants, but less as the kids grow. This amounts to about $5000 today, but was only $1600 in 1990—a 214% increase, or 3.42% per year.

For food expenditure, I’m going to use the USDA’s thrifty plan for June of that year. I’ll use the figures assuming that one child is 6 and the other is 9. I don’t have data before 1994, so I’ll extrapolate that with the average growth rate of 3.2%.

Food expenditures have been at a fairly consistent 11% of disposable income since 1990; so I’m going to include them as 2*11%*40*50*(after-tax median wage) = 440*(after-tax median wage).

The figures I had the hardest time getting were for utilities. It’s also difficult to know what to include: Is Internet access a necessity? Probably, nowadays—but not in 1990. Should I separate electric and natural gas, even though they are partial substitutes? But using these figures I estimate that utility costs rise at about 0.8% per year in CPI-adjusted terms, so what I’ll do is benchmark to $3800 in 2016 and assume that utility costs have risen by (0.8% + inflation rate) per year each year.

Healthcare is also a tough one; pardon the heteronormativity, but for simplicity I’m going to use the mean personal healthcare expenditures for one man and woman (aged 19-44) and one boy and one girl (aged 0-18). Unfortunately I was only able to find that for two-year intervals in the range from 2002 to 2020, so I interpolated and extrapolated both directions assuming the same average growth rate of 3.5%.

So let’s summarize what all is included here:

  • Estimated payment on a mortgage
  • 0.5 years of college tuition
  • amortized cost of 2 cars
  • 7500/(median MPG) gallons of gasoline
  • amortized cost of 2 phones, 1 computer, and 1 television
  • average spending on clothes
  • 11% of income on food
  • Estimated utilities spending
  • Estimated childcare equivalent to five months of infant care
  • Healthcare for one man, one woman, one boy, one girl

There are obviously many criticisms you could make of these choices. If I were writing a proper paper, I would search harder for better data and run robustness checks over the various estimation and extrapolation assumptions. But for these purposes I really just want a ballpark figure, something that will give me a sense of what rising cost of living feels like to most people.

What I found absolutely floored me. Over the range from 1990 to 2024:

  1. The Index of Necessary Expenditure rose by an average of 3.45% per year, almost a full percentage point higher than the average CPI inflation of 2.62% per year.
  2. Over the same period, after-tax income rose at a rate of 3.31%, faster than CPI inflation, but slightly slower than the growth rate of INE.
  3. The Index of Necessary Expenditure was over 100% of median after-tax household income every year except 2020.
  4. Since 2021, the Index of Necessary Expenditure has risen at an average rate of 5.74%, compared to CPI inflation of only 2.66%. In that same time, after-tax income has only grown at a rate of 4.94%.

Point 3 is the one that really stunned me. The only time in the last 34 years that a family of four has been able to actually pay for all necessities—just necessities—on a typical household income was during the COVID pandemic, and that in turn was only because the federal tax burden had been radically reduced in response to the crisis. This means that every single year, a typical American family has been either going further and further into debt, or scrimping on something really important—like healthcare or education.

No wonder people feel like the economy is failing them! It is!

In fact, I can even make sense now of how Trump could convince people with “Are you better off than you were four years ago?” in 2024 looking back at 2020—while the pandemic was horrific and the disruption to the economy was massive, thanks to the US government finally actually being generous to its citizens for once, people could just about actually make ends meet. That one year. In my entire life.

This is why people felt betrayed by Biden’s economy. For the first time most of us could remember, we actually had this brief moment when we could pay for everything we needed and still have money left over. And then, when things went back to “normal”, it was taken away from us. We were back to no longer making ends meet.

When I went into this, I expected to see that the INE had risen faster than both inflation and income, which was indeed the case. But I expected to find that INE was a large but manageable proportion of household income—maybe 70% or 80%—and slowly growing. Instead, I found that INE was greater than 100% of income in every year but one.

And the truth is, I’m not sure I’ve adequately covered all necessary spending! My figures for childcare and utilities are the most uncertain; those could easily go up or down by quite a bit. But even if I exclude them completely, the reduced INE is still greater than income in most years.

Suddenly the way people feel about the economy makes a lot more sense to me.

Housing prices are out of control

Oct 2 JDN 2459855

This is a topic I could have done for quite awhile now, and will surely address again in the future; it’s a slow-burn crisis that has covered most of the world for a generation.

In most of the world’s cities, housing prices are now the highest they have ever been, even adjusted for inflation. The pandemic made this worse, but it was already bad.

This is of course very important, because housing is usually the largest expenditure for most families.

Changes in housing prices are directly felt in people’s lifestyles, especially when they are renting. Homeownership rates vary a lot between countries, so the impact of this is quite different in different places.

There’s also an important redistributive effect: When housing prices go up, people who own homes get richer, while people who rent homes get poorer. Since people who own homes tend to be richer to begin with (and landlordsare typically richest of all), rising housing prices directly increase wealth inequality.

The median price of a house in the US, even adjusted for inflation, is nearly twice what it was in 1993.

This wasn’t a slow and steady climb; housing prices moved with inflation for most of the 1980s and 1990s, and then surged upward just before the 2008 crash. Then they plummeted for a few years, before reversing course and surging even higher than they were at their 2007 peak:

https://fred.stlouisfed.org/series/CSUSHPINSA

[housing_prices_US_2.png]

https://fred.stlouisfed.org/series/USSTHPI

This is not a uniquely American problem. The UK shows almost the same pattern:

https://fred.stlouisfed.org/series/HPIUKA

But it’s also not the same pattern everywhere. In China, housing prices have been rising steadily, and didn’t crash in 2008:

https://fred.stlouisfed.org/series/QCNN628BIS

In France, housing prices have been relatively stable, and are no higher now than they were in the 1990s:

https://fred.stlouisfed.org/series/CP0410FRM086NEST

Meanwhile, in Japan, housing prices surged in the 1970s, 1980s, and 1990s, ending up four times what they had been in the 1960s; then they suddenly leveled off and haven’t changed since:

https://fred.stlouisfed.org/series/JPNCPIHOUMINMEI

It’s also worse in some cities than others. In San Francisco, housing now costs three times what it did in the 1990s, even adjusting for inflation:

https://fred.stlouisfed.org/series/SFXRSA

Meanwhile, in Detroit, housing is only about 25% more expensive now than it was in the 1990s:

https://fred.stlouisfed.org/series/ATNHPIUS19804Q

This variation tells me that policy matters. This isn’t some inevitable result of population growth or technological change. Those could still be important factors, but they can’t explain the strong varation between countries or even between cities within the same country. (Yes, San Francisco has seen more population growth than Detroit—but not that much more.)

Part of the problem, I think, is that most policymakers don’t actually want housing to be more affordable. They might say they do, they might occasionally feel some sympathy for people who get evicted or live on the streets; but in general, they want housing prices to be higher, because that gives them more property tax revenue. The wealthy benefit from rising housing prices, while the poor are harmed. Since the interests of the wealthy are wildly overrepresented in policy, policy is made to increase housing prices, not decrease them. This is likely especially true in housing, because even the upper-middle class mostly benefits from rising housing prices. It’s only the poor and lower-middle class who are typically harmed.

This is why I don’t really want to get into suggesting policies that could fix this. We know what would fix this: Build more housing. Lots of it. Everywhere. Increase supply, and the price will go down. And we should keep doing it until housing is not just back where it was, but cheaper—much cheaper. Buying a house shouldn’t be a luxury afforded only to the upper-middle class; it should be something everyone does several times in their life and doesn’t have to worry too much about. Buying a house should be like buying a car; not cheap, exactly, but you don’t have to be rich to do it. Because everyone needs housing. So everyone should have housing.

But that isn’t going to happen, because the people who make the decisions about this don’t want it to happen.

So the real question becomes: What do we do about that?

The asymmetric impact of housing prices

Jul 22 JDN 2458323

In several previous posts I’ve talked about the international crisis of high housing prices. Today, I want to talk about some features of housing that make high housing prices particularly terrible, in a way that other high prices would not be.

First, there is the fact that some amount of housing is a basic necessity, and houses are not easily divisible. So even if the houses being built are bigger than you need, you still need some kind of house, and you can’t buy half a house; the best you could really do would be to share it with someone else, and that introduces all sorts of other complications.

Second, t here is a deep asymmetry here. While rising housing prices definitely hurt people who want to buy houses, they benefit hardly anyone.


If you bought a house for $200,000 and then all housing prices doubled so it would now sell for $400,000, are you richer? You might feel richer. You might even have access to home equity loans that would give you more real liquidity. But are you actually richer?

I contend you are not, because the only way for you to access that wealth would be to sell your home, and then you’d need to buy another home, and that other home would also be twice as expensive. The amount of money you can get for your house may have increased, but the amount of house you can get for your house is exactly the same.

Conversely, suppose that housing prices fell by half, and now that house only sells for $100,000. Are you poorer? You still have your house. Even if your mortgage isn’t paid off, it’s still the same mortgage. Your payments haven’t changed. And once again, the amount of house you can get for your house will remain the same. In fact, if you are willing to accept a deed in lieu of foreclosure (it’s bad for your credit, of course), you can walk away from that underwater house and buy a new one that’s just as good with lower payments than what you are currently making. You may actually be richer because the price of your house fell.

Relative housing prices matter, certainly. If you own a $400,000 house and move to a city where housing prices have fallen to $100,000, you are definitely richer. And if you own a $100,000 house and move to a city where housing prices have risen to $400,000, you are definitely poorer. These two effects necessarily cancel out in the aggregate.

But do absolute housing prices matter for homeowners? It really seems to me that they don’t. The people who care about absolute housing prices are not homeowners; they are people trying to enter the market for the first time.
And this means that lower housing prices are almost always better. If you could buy a house for $1,000, we would live in a paradise where it was basically impossible to be homeless. (When social workers encountered someone who was genuinely homeless, they could just buy them a house then and there.) If every home cost $10 million, those who bought homes before the price surge would be little better off than they are, but the rest of us would live on the streets.

Psychologically, people very strongly resist falling housing prices. Even in very weak housing markets, most people will flatly refuse to sell their house for less than they paid for it. As a result, housing prices usually rise with inflation, but don’t usually fall in response to deflation. Rents also display similar rigidity over time. But in reality, lower prices are almost always better for almost everyone.

There is a group of people who are harmed by low housing prices, but it is a very small group of people, most of whom are already disgustingly rich: The real estate industry. Yes, if you build new housing, or flip houses, or buy and sell houses on speculation, you will be harmed by lower housing prices. Of these, literally the only one I care about even slightly is developers; and I only care about developers insofar as they are actually doing their job building housing that people need. If falling prices hurt developers, it would be because the supply of housing was so great that everyone who needs a house could have one.

There is a subtler nuance here, which is that some people may be buying more expensive housing as a speculative saving vehicle, hoping that they can cash out on their house when they retire. To that, I really only have one word of advice: Don’t. Don’t contribute to another speculative housing bubble that could cause another Great Recession. A house is not even a particularly safe investment, because it’s completely undiversified. Buy stocks. Buy all the stocks. Buy a house because you want that house, not because you hope to make money off of it.

And if the price of your house does fall someday? Don’t panic. You may be no worse off, and other people are probably much better off.

The housing shortage is an international phenomenon

Jul 1 JDN 2458301

My posts for the next couple of weeks are going to be shorter, since I am in Europe and will be either on vacation (at the time I write this) or busy with a conference and a workshop (by the time this post goes live).

For today, I’d just like to point out that the crisis of extremely high housing prices is not unique to California or even the United States. In some respects it may even be worse elsewhere.

San Francisco remains especially bad; the median price for a home in San Francisco is a horrifying $1.6 million.

But London (where I am at the time of writing) is also terrible; the median price for a home in London recently fell to 430,000 pounds (about $600,000 at current exchange rates). The most expensive flat—not house, flat—sold a couple years ago for the mind-boggling sum of 150 million pounds (about $200 million). If I had $200 million, I would definitely not use it to buy a flat. At that point it would literally be cheaper to buy a yacht with a helipad, park it in the harbor, and commute by helicopter. Here’s a yacht with a helipad for only $20 million, and a helicopter to go with it for $6 million. That leaves $174 million; keep $20 million in stocks to be independently wealthy for the rest of your life, and then donate the remaining $154 million to charity.

The median price of a house in Vancouver stands at 1.1 million Canadian dollars, about $830,000 US.

A global comparison finds that on a per-square-meter basis, the most expensive real estate in the world is in Monaco, where $1 million US will only buy you 15 square meters. The remaining cities in the top 10 are Hong Kong, London, Singapore, Geneva, New York, Sydney, Paris, Moscow, and Shanghai.

There is astonishing variation in the level of housing prices, even within countries. Some of the most affordable markets in the US (like San Antonio and Oklahoma City) cost as little as $80 per square foot; that means that $1 million would buy you 1,160 square meters. That’s not an error; real estate in Monaco is literally 77 times more expensive than real estate in Oklahoma City. 15 square meters is a studio apartment; 1,160 square meters is a small mansion. Just comparing within the US, the price per square foot in San Francisco is over $1,120, 14 times as high as Oklahoma City. $1 million in San Francisco will buy you about 80 square meters, which is at least a two or three-bedroom house.

This says to me that policy choices matter. It may not be possible to make San Francisco as cheap as Oklahoma City—most people would definitely rather live in San Francisco, so demand is always going to be higher there. But I don’t think it’s very plausible to say that housing is just inherently 14 times as expensive to construct as housing in Oklahoma City. If it’s really that much more expensive to construct (and that may not even be the issue—this could be more a matter of oligopoly than high costs), it must be at least in part because of something the local and state governments are doing differently. Cross-national comparisons underscore that point even further: The geography of Hong Kong and Taiwan is not that different, but housing prices in Taiwan are not nearly as high.

What exactly are different cities (and countries) doing differently that has such large effects on housing prices? That’s something I’ll try to figure out in future posts.

Why is housing so expensive?

Apr 30, JDN 2457874

It’s not your imagination: Housing is a lot more expensive than it used to be. Inflation adjusted into 2000 dollars, the median price of a house has risen from $30,600 in 1940 to $119,600 today. Adjusted to today’s dollars, that’s an increase from $44,000 to $173,000.

Things are particularly bad here in California, where the median price of a new home is $517,000—and especially in the Bay Area, where the median price is $838,000. Just two years ago, people were already freaking out that the median home price in the Bay Area had hit $661,000—and now it has risen 27% since then.

The rent is too damn high, but lately rent has actually not been rising as fast as housing prices. It may be that they’ve just gotten as high as they can get; in New York City rent is stable, and in San Francisco it’s actually declining—but in both cases it’s over $4,000 per month for a 2-bedroom apartment. The US still has the highest rent-to-price ratio in the world; at 11.2%, you should be able to buy a house on a 15-year mortgage for what we currently pay in rent near city centers.

But this is not a uniquely American problem.

It’s a problem in Canada: Housing in the Toronto area recently skyrocketed in price, with the mean price of a detached home now over $974,000 CAD, about $722,000 USD.

It’s a problem in the UK: The average price of a home in the UK is now over 214,000 pounds, or $274,000 (the pound is pretty weak after Brexit). In London in particular, the average home now costs nine years of the average wage.

It’s even a problem in China: An average 1000-square-foot apartment (that’s not very big!) in Shanghai now sells for 5 million yuan, which is about $725,000.

Worldwide, the US actually has a relatively low housing price to income ratio, because our incomes are so high. Venezuela’s economy is in such a terrible state that it is literally impossible for the average person to buy the average home, but in countries as diverse as France, Taiwan, and Peru, the average home still costs more than 10 years of the average household income.

Why is this happening? Why is housing so expensive, and getting worse all the time?

There are a lot of reasons that have been proposed.

The most obvious and fundamental reason is basic supply and demand. Demand for housing in major cities is rapidly rising, and supply of housing just isn’t keeping up.

Indeed, in California, the rate of new housing construction has fallen in recent years, even as we’ve had rapid population growth and skyrocketing housing prices. This is probably the number one reason why our housing here is so expensive.

But that raises its own questions: why aren’t more houses getting built? The market is supposed to correct for this sort of thing. Higher prices incentivize more construction, so prices get brought back down.

I think with housing in particular, we have a fundamental problem with that mechanism, and it is this: The people who make the policy don’t want the prices to come down.

No, I’m not talking about mayors and city councils, though they do like their property tax revenue. I’m talking about homeowners. People who go to homeowners’ association meetings and complain that someone else’s lopsided deck or un-weeded garden is “lowering property values”. People who join NIMBY political campaigns to stop new development, prevent the construction of taller buildings, or even stop the installation of new electrical substations. People who already got theirs and don’t care about anyone else.

Homeowners have an enormous influence in local politics, and it is by local politics that most of these decisions about zoning and development are made. They make all kinds of excuses about “preserving the community” and “the feel of the city”, but when you get right down to it, these people care more about preserving their own home equity than they do about making other people homeless.

In some cases, people may be so fundamentally confused that they think new development actually somehow causes higher housing prices, and so they try to fight development in a vain effort to stop rising housing prices and only end up making things worse. It’s also very common for people to support rent control policies in an effort to keep housing affordable—and economists of all political stripes are in almost total consensus that rent control only serves to restrict supply, increase inequality, and make housing prices even worse. As one might expect, the stricter the rent control, the worse this effect is. Some mild forms of rent control might be justifiable in particularly monopolistic markets, but in general it’s not a good long-term solution. Rent control forces rationing, and often the rationing is not in favor of who needs it the most but who is the most well-connected. The people who benefit most from rent control are usually of higher income than the average for the city.

On the other hand, removing rent control can cause a spike in prices, and make things worse in the short run, before there is time for new construction to increase the supply of housing. Also, many economists assume in their models that tenants who get forced out by the higher rents would get compensated for it, which is not at all how the real world works. It’s also unclear exactly how large the effect sizes are, because the empirical studies get quite mixed results. Still, rent control is a bad idea. Don’t take it from me, take it from Paul Krugman.

It’s also common to blame foreign investors—because humans are tribal, and blaming foreigners is always popular—even though that makes no economic sense. Investors are buying your houses because the prices keep rising. It’s possible that there could be some sort of speculative bubble, but that’s actually harder to sustain in housing than it is in most other assets, precisely because houses are immobile and expensive. Speculative bubbles in gold happen all the time (indeed, perhaps literally all the time, as the price of gold has never fallen to its real fundamental value in all of human history), but gold is a tradeable, transportable, fungible commodity that can be bought in arbitrarily small quantities. (Because it’s an element, you’re literally only limited to the atomic level!)

Moreover, it isn’t just supply and demand at work here. Fluctuations in economic growth have strong effects on housing prices—and vice-versa. There are monetary policy effects, particularly in a liquidity trap; lower interest rates combined with low inflation create a perfect storm for higher housing prices.

Overall economic inequality is a major contributor to steep housing prices, as well as the segregation of housing across racial and economic lines. And as the rate of return on productive capital continues to decrease while the rate of return on real estate does not, more and more of our wealth concentration is going to be in the form of higher housing prices—making the whole problem self-reinforcing.

People also seem really ambivalent about whether they want housing prices to be low or high. In one breath they’ll bemoan the lack of affordable housing, and in another they’ll talk about “protecting property values”. Even the IMF called the increase in housing prices after the Second Depression a “recovery”. Is it really so hard to understand that higher prices mean higher prices?

But we think of housing as two fundamentally different things. On the one hand, it’s a durable consumption good, like a car or a refrigerator—something you buy because it’s useful, and keep around to use for a long time. On the other hand, it’s a financial asset—a store of value for your savings and a potential source of income. When you’re thinking of it as a consumption good, you want it to be “affordable”; when you’re thinking of it as an asset, you want to “protect its value”. But it’s the same house with the same price. You can’t do both of those things at once, and clearly, as a society—perhaps as a civilization—we have been tilting way too far in the “asset” direction.

I get it: Financial assets that grow over time have the allure of easy money. The stock market, the derivatives market, even the lottery and Las Vegas, all have this tantalizing property that they seem to give you money for nothing. They are like the quest for the Philosopher’s Stone in days of yore.

But they are just as much a chimera as the Philosopher’s Stone itself. (Also, if anyone had found the Philosopher’s Stone, the glut of gold would have triggered massive inflation, not unlike what happened in Spain in the 16th century.) Any money you get from simply owning an asset or placing a bet is money that had to come from somewhere else. In the case of the stock market, that “somewhere else” is the profits of the corporations you bought, and if you did actually contribute to the investment of those corporations there’s nothing wrong with you getting a proportional share of those profits. But most people aren’t thinking in those terms when they buy stocks, and once you get all the way to sophisticated derivatives you’re basically in full gambling territory. Every option that’s in the money is another option that’s out of the money. Every interest rate swap that turns a profit is another one that bears a loss.

And when it comes to housing, if you magically gain equity from rising property values, where is that money coming from? It’s coming from people desperately struggling to afford to live in your city, people giving up 40%, 50%, even 60% of their disposable income just for the chance to leave in a tiny apartment because they want to be in your city that badly. It’s coming from people who started that way, lost their job, and ended up homeless because they couldn’t sustain the payments anymore. All that easy money is coming from hard-working young people trying to hold themselves out of poverty.

It’s different if your home gains value because you actually did something to make it better—renovations, additions, landscaping. Even then I think these things are sort of overrated; but they do constitute a real economic benefit to the people who live there. But if your home rises in value because zoning regulations and protesting homeowners stop the construction of new high-rises, that’s very much still on the backs of struggling young people.

We need to stop thinking houses as assets that are supposed to earn a return, and instead think of them as consumption goods that provide benefits to people. If you want a return, buy stocks and bonds. When you’re buying a house, you should be buying a house—not some dream of making money for nothing as housing prices rise forever. Because they can’t—sooner or later, the bubble will break—and even if they could, it would be terrible for everyone who didn’t get into the market soon enough.

Asymmetric nominal rigidity, or why everything is always “on sale”

July 9, JDN 2457579

The next time you’re watching television or shopping, I want you to count the number of items that are listed as “on sale” versus the number that aren’t. (Also, be careful to distinguish labels like “Low Price!” and “Great Value!” that are dressed up like “on sale” labels but actually indicate the usual price.) While “on sale” is presented as though it’s something rare and special, in reality anywhere from a third to half of all products are on sale at any given time. At some retailers (such as Art Van Furniture and Jos. A. Bank clothing), literally almost everything is almost always on sale.

There is a very good explanation for this in terms of cognitive economics. It is a special case of a more general phenomenon of asymmetric nominal rigidity. Asymmetric nominal rigidity is the tendency of human beings to be highly resistant to (rigidity) changes in actual (nominal) dollar prices, but only in the direction that hurts them (asymmetric). Ultimately this is an expression of the far deeper phenomenon of loss aversion, where losses are felt much more than gains.

Usually we actually talk about downward nominal wage rigidity, which is often cited as a reason why depressions can get so bad. People are extremely resistant to having their wages cut, even if there is a perfectly good reason to do so, and even if the economy is under deflation so that their real wage is not actually falling. It doesn’t just feel unpleasant; it feels unjust. People feel betrayed when they see the numbers on their paycheck go down, and they are willing to bear substantial costs to retaliate against that injustice—typically, they quit or go on strike. This reduces spending, which then exacerbates the deflation, which requires more wage cuts—and down we go into the spiral of depression, unless the government intervenes with monetary and fiscal policy.

But what does this have to do with everything being on sale? Well, for every downward wage rigidity, there is an upward price rigidity. When things become more expensive, people stop buying them—even if they could still afford them, and often even if the price increase is quite small. Again, they feel in some sense betrayed by the rising price (though not to the same degree as they feel betrayed by falling wages, due to their closer relationship to their employer). Responses to price increases are about twice as strong as responses to price decreases, just as losses are felt about twice as much as gains.

Businesses have figured this out—in some ways faster than economists did—and use it to their advantage; and thus so many things are “on sale”.

Actually, “on sale” serves two functions, which can be distinguished according to their marketing strategies. Businesses like Jos. A. Bank where almost everything is on sale are primarily exploiting anchoring—they want people to think of the listed “retail price” as the default price, and then the “sale price” that everyone actually pays feels lower as a result. If they “drop” the price of something from $300 to $150 feels like the company is doing you a favor; whereas if they had just priced it at $150 to begin with, you wouldn’t get any warm fuzzy feelings from that. This works especially well for products that people don’t purchase very often and aren’t accustomed to comparing—which is why you see it in furniture stores and high-end clothing retailers, not in grocery stores and pharmacies.

But even when people are accustomed to shopping around and are familiar with what the price ordinarily would be, sales serve a second function, because of asymmetric nominal rigidity: They escape that feeling of betrayal that comes from raising prices.

Here’s how it works: Due to the thousand natural shocks that flesh is heir to, there will always be some uncertainty in the prices you will want to set in the future. Future prices may go up, they may go down; and people spend their lives trying to predict this sort of thing and rarely outperform chance. But if you just raise and lower your prices as the winds blow (as most neoclassical economists generally assume you will), you will alienate your customers. Just as a ratchet works by turning the bolt more in one direction than the other, this sort of roller-coaster pricing would attract a small number of customers with each price decrease, then repel a larger number with each increase, until after a few cycles of rise and fall you would run out of customers. This is the real source of price rigidities, not that silly nonsense about “menu costs”. Especially in the Information Age, it costs almost nothing to change the number on the label—but change it wrong and it may cost you the customer.

One response would simply be to set your price at a reasonable estimate of the long-term optimal average price, but this leaves a lot of money on the table, as some times it will be too low (your inventory sells out and you make less profit than you could have), and even worse, other times it will be too high (customers refuse to buy your product). If only there were a way to change prices without customers feeling so betrayed!

Well, it turns out, there is, and it’s called “on sale”. You have a new product that you want to sell. You start by setting the price of the product at about the highest price you would ever need to sell it in the foreseeable future. Then, unless right now happens to be a time where demand is high and prices should also be high, you immediately put it on sale, and have the marketing team drum up some excuse about wanting to draw attention to your exciting new product. You put a deadline on that sale, which may be explicit (“Ends July 30”) or vague (“For a Limited Time!” which is technically always true—you merely promise that your sale will not last until the heat death of the universe), but clearly indicates to customers that you are not promising to keep this price forever.

Then, when demand picks up and you want to raise the price, you can! All you have to do is end the sale, which if you left the deadline vague can be done whenever you like. Even if you set explicit deadlines (which will make customers even more comfortable with the changes, and also give them a sense of urgency that may lead to more impulse buying), you can just implement a new sale each time the last one runs out, varying the discount according to market conditions. Customers won’t retaliate, because they won’t feel betrayed; you said fair and square the sale wouldn’t last forever. They will still buy somewhat less, of course; that’s the Law of Demand. But they won’t overcompensate out of spite and outrage; they’ll just buy the amount that is their new optimal purchase amount at this new price.

Coupons are a lot like sales, but they’re actually even more devious; they allow for a perfectly legal form of price discrimination. Businesses know that only certain types of people clip coupons; roughly speaking, people who are either very poor or very frugal—either way, people who are very responsive to prices. Coupons allow them to set a lower price for those groups of people, while setting a higher price for other people whose demand is more inelastic. A similar phenomenon is going on with student and senior discounts; students and seniors get lower prices because they typically have less income than other adults (though why there is so rarely a youth discount, only a student discount, I’m actually not sure—controlling for demographics, students are in general richer than non-students).

Once you realize this is what’s happening, what should you do as a customer? Basically, try to ignore whether or not a label says “on sale”. Look at the actual number of the price, and try to compare it to prices you’ve paid in the past for that product, as well as of course how much value the product is worth to you. If indeed this is a particularly low price and the product is durable, you may well be wise to purchase more and stock up for the future. But you should try to train yourself to react the same way to “On sale, now $49.99” as you would to simply “$49.99”. (Making your reaction exactly the same is probably impossible, but the closer you can get the better off you are likely to be.) Always compare prices from multiple sources for any major purchase (Amazon makes this easier than ever before), and compare actual prices you would pay—with discounts, after taxes, including shipping. The rest is window dressing.

If you get coupons or special discounts, of course use them—but only if you were going to make the purchase anyway, or were just barely on the fence about it. Rarely is it actually rational for you to buy something you wouldn’t have bought just because it’s on sale for 50% off, let alone 10% off. It’s far more likely that you’d either want to buy it anyway, or still have no reason to buy it even at the new price. Businesses are of course hoping you’ll overcompensate for the discount and buy more than you would have otherwise. Foil their plans, and thereby make your life better and our economy more efficient.

Tax incidence revisited, part 2: How taxes affect prices

JDN 2457341

One of the most important aspects of taxation is also one of the most counter-intuitive and (relatedly) least-understood: Taxes are not externally applied to pre-existing exchanges of money. Taxes endogenously interact with the system of prices, changing what the prices will be and then taking a portion of the money exchanged.

The price of something “before taxes” is not actually the price you would pay for it if there had been no taxes on it. Your “pre-tax income” is not actually the income you would have had if there were no income or payroll taxes.

The most obvious case to consider is that of government employees: If there were no taxes, public school teachers could not exist, so the “pre-tax income” of a public school teacher is a meaningless quantity. You don’t “take taxes out” of a government salary; you decide how much money the government employee will actually receive, and then at the same time allocate a certain amount into other budgets based on the tax code—a certain amount into the state general fund, a certain amount into the Social Security Trust Fund, and so on. These two actions could in principle be done completely separately; instead of saying that a teacher has a “pre-tax salary” of $50,000 and is taxed 20%, you could simply say that the teacher receives $40,000 and pay $10,000 into the appropriate other budgets.

In fact, when there is a conflict of international jurisdiction this is sometimes literally what we do. Employees of the World Bank are given immunity from all income and payroll taxes (effectively, diplomatic immunity, though this is not usually how we use the term) based on international law, except for US citizens, who have their taxes paid for them by the World Bank. As a result, all World Bank salaries are quoted “after-tax”, that is, the actual amount of money employees will receive in their paychecks. As a result, a $120,000 salary at the World Bank is considerably higher than a $120,000 salary at Goldman Sachs; the latter would only (“only”) pay about $96,000 in real terms.

For private-sector salaries, it’s not as obvious, but it’s still true. There is actually someone who pays that “before-tax” salary—namely, the employer. “Pre-tax” salaries are actually a measure of labor expenditure (sometimes erroneously called “labor costs”, even by economists—but a true labor cost is the amount of effort, discomfort, stress, and opportunity cost involved in doing labor; it’s an amount of utility, not an amount of money). The salary “before tax” is the amount of money that the employer has to come up with in order to pay their payroll. It is a real amount of money being exchanged, divided between the employee and the government.

The key thing to realize is that salaries are not set in a vacuum. There are various economic (and political) pressures which drive employers to set different salaries. In the real world, there are all sorts of pressures that affect salaries: labor unions, regulations, racist and sexist biases, nepotism, psychological heuristics, employees with different levels of bargaining skill, employers with different concepts of fairness or levels of generosity, corporate boards concerned about public relations, shareholder activism, and so on.

But even if we abstract away from all that for a moment and just look at the fundamental economics, assuming that salaries are set at the price the market will bear, that price depends upon the tax system.

This is because taxes effectively drive a wedge between supply and demand.

Indeed, on a graph, it actually looks like a wedge, as you’ll see in a moment.

Let’s pretend that we’re in a perfectly competitive market. Everyone is completely rational, we all have perfect information, and nobody has any power to manipulate the market. We’ll even assume that we are dealing with hourly wages and we can freely choose the number of hours worked. (This is silly, of course; but removing this complexity helps to clarify the concept and doesn’t change the basic result that prices depend upon taxes.)

We’ll have a supply curve, which is a graph of the minimum price the worker is willing to accept for each hour in order to work a given number of hours. We generally assume that the supply curve slopes upward, meaning that people are willing to work more hours if you offer them a higher wage for each hour. The idea is that it gets progressively harder to find the time—it eats into more and more important alternative activities. (This is in fact a gross oversimplification, but it’ll do for now. In the real world, labor is the one thing for which the supply curve frequently bends backward.)

supply_curve

We’ll also have a demand curve, which is a graph of the maximum price the employer is willing to pay for each hour, if the employee works that many hours. We generally assume that the demand curve slopes downward, meaning that the employer is willing to pay less for each hour if the employee works more hours. The reason is that most activities have diminishing marginal returns, so each extra hour of work generally produces less output than the previous hour, and is therefore not worth paying as much for. (This too is an oversimplification, as I discussed previously in my post on the Law of Demand.)

demand_curve

Put these two together, and in a competitive market the price will be set at the point at which supply is equal to demand, so that the very last hour of work was worth exactly what the employer paid for it. That last hour is just barely worth it to the employer, and just barely worth it to the worker; any additional time would either be too expensive for the employer or not lucrative enough for the worker. But for all the previous hours, the value to the employer is higher than the wage, and the cost to the worker is lower than the wage. As a result, both the employer and the worker benefit.

equilibrium_notax

But now, suppose we implement a tax. For concreteness, suppose the previous market-clearing wage was $20 per hour, the worker was working 40 hours, and the tax is 20%. If the employer still offers a wage of $20 for 40 hours of work, the worker is no longer going to accept it, because they will only receive $16 per hour after taxes, and $16 isn’t enough for them to be willing to work 40 hours. The worker could ask for a pre-tax wage of $25 so that the after-tax wage would be $20, but then the employer will balk, because $25 per hour is too expensive for 40 hours of work.

In order to restore the balance (and when we say “equilibrium”, that’s really all we mean—balance), the employer will need to offer a higher pre-tax wage, which means they will demand fewer hours of work. The worker will then be willing to accept a lower after-tax wage for those reduced hours.

In effect, there are now two prices at work: A supply price, the after-tax wage that the worker receives, which must be at or above the supply curve; and a demand price, the pre-tax wage that the employer pays, which must be at or below the demand curve. The difference between those two prices is the tax.

equilibrium_tax

In this case, I’ve set it up so that the pre-tax wage is $22.50, the after-tax wage is $18, and the amount of the tax is $4.50 or 20% of $22.50. In order for both the employer and the worker to accept those prices, the amount of hours worked has been reduced to 35.

As a result of the tax, the wage that we’ve been calling “pre-tax” is actually higher than the wage that the worker would have received if the tax had not existed. This is a general phenomenon; it’s almost always true that your “pre-tax” wage or salary overestimates what you would have actually gotten if the tax had not existed. In one extreme case, it might actually be the same; in another extreme case, your after-tax wage is what you would have received and the “pre-tax” wage rises high enough to account for the entirety of the tax revenue. It’s not really “pre-tax” at all; it’s the after-tax demand price.

Because of this, it’s fundamentally wrongheaded for people to complain that taxes are “taking your hard-earned money”. In all but the most exceptional cases, that “pre-tax” salary that’s being deducted from would never have existed. It’s more of an accounting construct than anything else, or like I said before a measure of labor expenditure. It is generally true that your after-tax salary is lower than the salary you would have gotten without the tax, but the difference is generally much smaller than the amount of the tax that you see deducted. In this case, the worker would see $4.50 per hour deducted from their wage, but in fact they are only down $2 per hour from where they would have been without the tax. And of course, none of this includes the benefits of the tax, which in many cases actually far exceed the costs; if we extended the example, it wouldn’t be hard to devise a scenario in which the worker who had their wage income reduced received an even larger benefit in the form of some public good such as national defense or infrastructure.