Bet five dollars for maximum performance

JDN 2457433

One of the more surprising findings from the study of human behavior under stress is the Yerkes-Dodson curve:

OriginalYerkesDodson
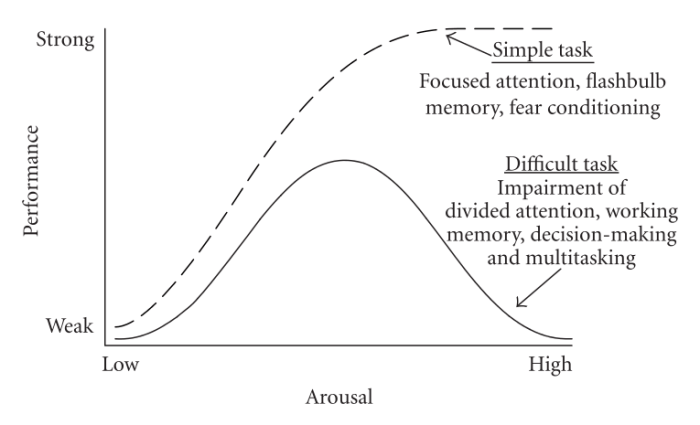
This curve shows how well humans perform at a given task, as a function of how high the stakes are on whether or not they do it properly.

For simple tasks, it says what most people intuitively expect—and what neoclassical economists appear to believe: As the stakes rise, the more highly incentivized you are to do it, and the better you do it.

But for complex tasks, it says something quite different: While increased stakes do raise performance to a point—with nothing at stake at all, people hardly work at all—it is possible to become too incentivized. Formally we say the curve is not monotonic; it has a local maximum.

This is one of many reasons why it’s ridiculous to say that top CEOs should make tens of millions of dollars a year on the rise and fall of their company’s stock price (as a great many economists do in fact say). Even if I believed that stock prices accurately reflect the company’s viability (they do not), and believed that the CEO has a great deal to do with the company’s success, it would still be a case of overincentivizing. When a million dollars rides on a decision, that decision is going to be worse than if the stakes had only been $100. With this in mind, it’s really not surprising that higher CEO pay is correlated with worse company performance. Stock options are terrible motivators, but do offer a subtle way of making wages adjust to the business cycle.

The reason for this is that as the stakes get higher, we become stressed, and that stress response inhibits our ability to use higher cognitive functions. The sympathetic nervous system evolved to make us very good at fighting or running away in the face of danger, which works well should you ever be attacked by a tiger. It did not evolve to make us good at complex tasks under high stakes, the sort of skill we’d need when calculating the trajectory of an errant spacecraft or disarming a nuclear warhead.

To be fair, most of us never have to worry about piloting errant spacecraft or disarming nuclear warheads—indeed, you’re about as likely to get attacked by a tiger even in today’s world. (The rate of tiger attacks in the US is just under 2 per year, and the rate of manned space launches in the US was about 5 per year until the Space Shuttle was terminated.)

There are certain professions, such as pilots and surgeons, where performing complex tasks under life-or-death pressure is commonplace, but only a small fraction of people take such professions for precisely that reason. And if you’ve ever wondered why we use checklists for pilots and there is discussion of also using checklists for surgeons, this is why—checklists convert a single complex task into many simple tasks, allowing high performance even at extreme stakes.

But we do have to do a fair number of quite complex tasks with stakes that are, if not urgent life-or-death scenarios, then at least actions that affect our long-term life prospects substantially. In my tutoring business I encounter one in particular quite frequently: Standardized tests.

Tests like the SAT, ACT, GRE, LSAT, GMAT, and other assorted acronyms are not literally life-or-death, but they often feel that way to students because they really do have a powerful impact on where you’ll end up in life. Will you get into a good college? Will you get into grad school? Will you get the job you want? Even subtle deviations from the path of optimal academic success can make it much harder to achieve career success in the future.

Of course, these are hardly the only examples. Many jobs require us to complete tasks properly on tight deadlines, or else risk being fired. Working in academia infamously requires publishing in journals in time to rise up the tenure track, or else falling off the track entirely. (This incentivizes the production of huge numbers of papers, whether they’re worth writing or not; yes, the number of papers published goes down after tenure, but is that a bad thing? What we need to know is whether the number of good papers goes down. My suspicion is that most if not all of the reduction in publications is due to not publishing things that weren’t worth publishing.)

So if you are faced with this sort of task, what can you do? If you realize that you are faced with a high-stakes complex task, you know your performance will be bad—which only makes your stress worse!

My advice is to pretend you’re betting five dollars on the outcome.

Ignore all other stakes, and pretend you’re betting five dollars. $5.00 USD. Do it right and you get a Lincoln; do it wrong and you lose one.
What this does is ensures that you care enough—you don’t want to lose $5 for no reason—but not too much—if you do lose $5, you don’t feel like your life is ending. We want to put you near that peak of the Yerkes-Dodson curve.

The great irony here is that you most want to do this when it is most untrue. If you actually do have a task for which you’ve bet $5 and nothing else rides on it, you don’t need this technique, and any technique to improve your performance is not particularly worthwhile. It’s when you have a standardized test to pass that you really want to use this—and part of me even hopes that people know to do this whenever they have nuclear warheads to disarm. It is precisely when the stakes are highest that you must put those stakes out of your mind.

Why five dollars? Well, the exact amount is arbitrary, but this is at least about the right order of magnitude for most First World individuals. If you really want to get precise, I think the optimal stakes level for maximum performance is something like 100 microQALY per task, and assuming logarithmic utility of wealth, $5 at the US median household income of $53,600 is approximately 100 microQALY. If you have a particularly low or high income, feel free to adjust accordingly. Literally you should be prepared to bet about an hour of your life; but we are not accustomed to thinking that way, so use $5. (I think most people, if asked outright, would radically overestimate what an hour of life is worth to them. “I wouldn’t give up an hour of my life for $1,000!” Then why do you work at $20 an hour?)

It’s a simple heuristic, easy to remember, and sometimes effective. Give it a try.

Why Millennials feel “entitled”

JDN 2457064

I’m sure you’ve already heard this plenty of times before, but just in case here are a few particularly notable examples: “Millennials are entitled.” “Millennials are narcissistic.” “Millennials expect instant gratification.

Fortunately there are some more nuanced takes as well: One survey shows that we are perceived as “entitled” and “self-centered” but also “hardworking” and “tolerant”. This article convincingly argues that Baby Boomers show at least as much ‘entitlement’ as we do. Another article points out that young people have been called these sorts of names for decades—though actually the proper figure is centuries.

Though some of the ‘defenses’ leave a lot to be desired: “OK, admittedly, people do live at home. But that’s only because we really like our parents. And why shouldn’t we?” Uh, no, that’s not it. Nor is it that we’re holding off on getting married. The reason we live with our parents is that we have no money and can’t pay for our own housing. And why aren’t we getting married? Because we can’t afford to pay for a wedding, much less buy a home and start raising kids. (Since the time I drafted this for Patreon and it went live, yet another article hand-wringing over why we’re not getting married was publishedin Scientific American, of all places.)

Are we not buying cars because we don’t like cars? No, we’re not buying cars because we can’t afford to pay for them.

The defining attributes of the Millennial generation are that we are young (by definition) and broke (with very few exceptions). We’re not uniquely narcissistic or even tolerant; younger generations always have these qualities.

But there may be some kernel of truth here, which is that we were promised a lot more than we got.

Educational attainment in the United States is the highest it has ever been. Take a look at this graph from the US Department of Education:

Percentage of 25- to 29-year-olds who completed a bachelor’s or higher degree, by race/ethnicity: Selected years, 1990–2014

education_attainment_race

More young people of every demographic except American Indians now have college degrees (and those figures fluctuate a lot because of small samples—whether my high school had an achievement gap for American Indians depended upon how I self-identified on the form, because there were only two others and I was tied for the highest GPA).

Even the IQ of Millennials is higher than that of our parents’ generation, which is higher than their parents’ generation; (measured) intelligence rises over time in what is called the Flynn Effect. IQ tests have to be adjusted to be harder by about 3 points every 10 years because otherwise the average score would stop being 100.

As your level of education increases, your income tends to go up and your unemployment tends to go down. In 2014, while people with doctorates or professional degrees had about 2% unemployment and made a median income of $1590 per week, people without even high school diplomas had about 9% unemployment and made a median income of only $490 per week. The Bureau of Labor Statistics has a nice little bar chart of these differences:

education_employment_earnings

Now the difference is not quite as stark. With the most recent data, the unemployment rate is 6.7% for people without a high school diploma and 2.5% for people with a bachelor’s degree or higher.

But that’s for the population as a whole. What about the population of people 18 to 35, those of us commonly known as Millennials?

Well, first of all, our unemployment rate overall is much higher. With the most recent data, unemployment among people ages 20-24 is a whopping 9.4%. For ages 25 to 34 it gets better, 5.3%; but it’s still much worse than unemployment at ages 35-44 (4.0%), 45-54 (3.6%), or 55+ (3.2%). Overall, unemployment among Millennials is about 6.7% while unemployment among Baby Boomers is about 3.2%, half as much. (Gen X is in between, but a lot closer to the Boomers at around 3.8%.)

It was hard to find data specifically breaking it down by both age and education at the same time, but the hunt was worth it.

Among people age 20-24 not in school:

Without a high school diploma, 328,000 are unemployed, out of 1,501,000 in the labor force. That’s an unemployment rate of 21.9%. Not a typo, that’s 21.9%.

With only a high school diploma, 752,000 are unemployed, out of 5,498,000 in the labor force. That’s an unemployment rate of 13.7%.

With some college but no bachelor’s degree, 281,000 are unemployed, out of 3,620,000 in the labor force. That’s an unemployment rate of 7.7%.

With a bachelor’s degree, 90,000 are unemployed, out of 2,313,000 in the labor force. That’s an unemployment rate of 3.9%.

What this means is that someone 24 or under needs to have a bachelor’s degree in order to have the same overall unemployment rate that people from Gen X have in general, and even with a bachelor’s degree, people under 24 still have a higher unemployment rate than what Baby Boomers simply have by default. If someone under 24 doesn’t even have a high school diploma, forget it; their unemployment rate is comparable to the population unemployment rate at the trough of the Great Depression.

In other words, we need to have college degrees just to match the general population older than us, of whom only 20% have a college degree; and there is absolutely nothing a Millennial can do in terms of education to ever have the tiny unemployment rate (about 1.5%) of Baby Boomers with professional degrees. (Be born White, be in perfect health, have a professional degree, have rich parents, and live in a city with very high employment, and you just might be able to pull it off.)

So, why do Millennials feel like a college degree should “entitle” us to a job?

Because it does for everyone else.

Why do we feel “entitled” to a higher standard of living than the one we have?
Take a look at this graph of GDP per capita in the US:

US_GDP_per_capita

You may notice a rather sudden dip in 2009, around the time most Millennials graduated from college and entered the labor force. On the next graph, I’ve added a curve approximating what it would look like if the previous trend had continued:

US_GDP_per_capita_trend

(There’s a lot on this graph for wonks like me. You can see how the unit-root hypothesis seemed to fail in the previous four recessions, where economic output rose back up to potential; but it clearly held in this recession, and there was a permanent loss of output. It also failed in the recession before that. So what’s the deal? Why do we recover from some recessions and take a permanent blow from others?)

If the Great Recession hadn’t happened, instead of per-capita GDP being about $46,000 in 2005 dollars, it would instead be closer to $51,000 in 2005 dollars. In today’s money, that means our current $56,000 would be instead closer to $62,000. If we had simply stayed on the growth trajectory we were promised, we’d be almost 10 log points richer (11% for the uninitiated).

So, why do Millennials feel “entitled” to things we don’t have? In a word, macroeconomics.

People anchored their expectations of what the world would be like on forecasts. The forecasts said that the skies were clear and economic growth would continue apace; so naturally we assumed that this was true. When the floor fell out from under our economy, only a few brilliant and/or lucky economists saw it coming; even people who were paying quite close attention were blindsided. We were raised in a world where economic growth promised rising standard of living and steady employment for the rest of our lives. And then the storm hit, and we were thrown into a world of poverty and unemployment—and especially poverty and unemployment for us.

We are angry about how we had been promised more than we were given, angry about how the distribution of what wealth we do have gets ever more unequal. We are angry that our parents’ generation promised what they could not deliver, and angry that it was their own blind worship of the corrupt banking system that allowed the crash to happen.

And because we are angry and demand a fairer share, they have the audacity to call us “narcissistic”.

“Polarization” is not symmetric

I titled the previous post using the word “polarization”, because that’s the simplest word we have for this phenomenon; but its connotations really aren’t right. “Polarization” suggests that both sides have gotten more extreme, and as a result they are now more fiercely in conflict. In fact what has happened is that Democrats have more or less stayed where they were, while Republicans have veered off into insane far-right crypto-fascist crazyland.

If you don’t believe my graph from ThinkProgress, take it from The Washington Post.

Even when pollsters try to spin it so that maybe the Democrats have also polarized, the dimensions upon which Democrats have gotten “more extreme” are not being bigoted toward women, racial minorities, immigrants, and gay people. So while the Republicans have in fact gotten more extreme, Democrats have simply gotten less bigoted.

Yes, I suppose you can technically say that this means we’ve gotten “more extremely liberal on social issues”; but we live in a world in which “liberal on social issues” means “you don’t hate and oppress people based on who they are”. Democrats did not take on some crazy far-left social view like, I don’t know, legalizing marriage between humans and dogs. They just stopped being quite so racist, sexist, and homophobic.

It’s on issues where there is no obvious moral imperative that it makes sense to talk about whether someone has become more extreme to the left or the right.

Many economic issues are of this character; one could certainly go too far left economically if one were to talk about nationalizing the auto industry (because it worked so well in East Germany!) or repossessing and redistributing all farmland (what could possibly go wrong?). But Bernie Sanders’ “radical socialism” sounds a lot like FDR’s New Deal—which worked quite well, and is largely responsible for the rise of the American middle class.

Meanwhile, Donald Trump’s economic policy proposals (if you can even call them that) are so radical and so ad hoc that they would turn back the clock on decades of economic development and international trade. He wants to wage a trade war with China that would throw the US into recession and send millions of people in China back into poverty. And that’s not even including the human rights violations required to implement the 11 million deportations of immigrants that Trump has been clamoring for since day one.

Or how about national defense? There is room for reasonable disagreement here, and there definitely is a vein of naive leftist pacifism that tells us to simply stay out of it when other countries are invaded by terrorists or commit genocide.

FDR’s view on national defense can be found in his “Day of Infamy” speech after Pearl Harbor

The attack yesterday on the Hawaiian Islands has caused severe damage to American naval and military forces. I regret to tell you that very many American lives have been lost. In addition, American ships have been reported torpedoed on the high seas between San Francisco and Honolulu.

Yesterday the Japanese Government also launched an attack against Malaya.
Last night Japanese forces attacked Hong Kong.
Last night Japanese forces attacked Guam.
Last night Japanese forces attacked the Philippine Islands.
Last night the Japanese attacked Wake Island.
And this morning the Japanese attacked Midway Island.

Japan has therefore undertaken a surprise offensive extending throughout the Pacific area. The facts of yesterday and today speak for themselves. The people of the United States have already formed their opinions and well understand the implications to the very life and safety of our nation.

As Commander-in-Chief of the Army and Navy I have directed that all measures be taken for our defense, that always will our whole nation remember the character of the onslaught against us.

No matter how long it may take us to overcome this premeditated invasion, the American people, in their righteous might, will win through to absolute victory.

When Hillary Clinton lived through a similar event—9/11—this was her response:

We will also stand united behind our President as he and his advisors plan the necessary actions to demonstrate America’s resolve and commitment. Not only to seek out an exact punishment on the perpetrators, but to make very clear that not only those who harbor terrorists, but those who in any way aid or comfort them whatsoever will now face the wrath of our country. And I hope that that message has gotten through to everywhere it needs to be heard. You are either with America in our time of need or you are not.

We also stand united behind our resolve — as this resolution so clearly states — to recover and rebuild in the aftermath of these tragic acts. You know, New York was not an accidental choice for these madmen, these terrorists, and these instruments of evil. They deliberately chose to strike at a city, which is a global city — it is the city of the Twenty First century, it epitomizes who we are as Americans. And so this in a very real sense was an attack on America, on our values, on our power, and on who we are as a people. And I know — because I know America — that America will stand behind New York. That America will offer whatever resources, aid, comfort, support that New Yorkers and New York require. Because the greatest rebuke we can offer to those who attack our way of life is to demonstrate clearly that we are not cowed in any way whatsoever.

Sounds pretty similar to me.

Now, compare Eisenhower’s statements on the military to Ted Cruz’s.

First Eisenhower, his famous “Cross of Iron” speech

The best would be this: a life of perpetual fear and tension; a burden of arms draining the wealth and the labor of all peoples; a wasting of strength that defies the American system or the Soviet system or any system to achieve true abundance and happiness for the peoples of this earth.

Every gun that is made, every warship launched, every rocket fired signifies, in the final sense, a theft from those who hunger and are not fed, those who are cold and are not clothed.

This world in arms in not spending money alone.

It is spending the sweat of its laborers, the genius of its scientists, the hopes of its children.

The cost of one modern heavy bomber is this: a modern brick school in more than 30 cities.

It is two electric power plants, each serving a town of 60,000 population.

It is two fine, fully equipped hospitals.

It is some 50 miles of concrete highway.

We pay for a single fighter with a half million bushels of wheat.

We pay for a single destroyer with new homes that could have housed more than 8,000 people.

This, I repeat, is the best way of life to be found on the road the world has been taking.

This is not a way of life at all, in any true sense. Under the cloud of threatening war, it is humanity hanging from a cross of iron.

That is the most brilliant exposition of the opportunity cost of military spending I’ve ever heard. Let me remind you that Eisenhower was a Republican and a five-star general (we don’t even have those anymore; we stop at four stars except in major wars). He was not a naive pacifist, but a soldier who understood the real cost of war.

Now, Ted Cruz, in his political campaign videos:

Instead we will have a President who will make clear we will utterly destroy ISIS.We will carpet bomb them into oblivion. I don’t know if sand can glow in the dark, but we’re gonna find out. And we’re gonna make abundantly clear to any militant on the face of the planet, that if you go and join ISIS, if you wage jihad and declare war on America, you are signing your death warrant.


Under President Obama and Secretary Clinton the world is more dangerous, and America is less safe. If I’m elected to serve as commander-in-chief, we won’t cower in the face of evil. America will lead. We will rebuild our military, we will kill the terrorists, and every Islamic militant will know, if you wage jihad against us, you’re signing your death warrant.
And under no circumstances will I ever apologize for America.

In later debates Cruz tried to soften this a bit, but it ended up making him sound like he doesn’t understand what words mean. He tried to redefine “carpet bombing” to mean “precision missile strikes” (but of course, precision missile strikes are what we’re already doing). He tried to walk back the “sand can glow in the dark” line, but it’s pretty clear that the only way that line makes sense is if you intend to deploy nuclear weapons. (I’m pretty sure he didn’t mean bioluminescent phytoplankton.) He gave a speech declaring his desire to commit mass murder, and is now trying to Humpty Dumpty his way out of the outrage it provoked.

This is how far the Republican Party has fallen.

Medicaid expansion and the human cost of political polarization

JDN 2457422

As of this writing, there are still 22 of our 50 US states that have refused to expand Medicaid under the Affordable Care Act. Several other states (including Michigan) expanded Medicaid, but on an intentionally slowed timetable. The way the law was written, these people are not eligible for subsidized private insurance (because it was assumed they’d be on Medicaid!), so there are almost 3 million people without health insurance because of the refused expansions.

Why? Would expanding Medicaid on the original timetable be too arduous to accomplish? If so, explain why 13 states managed to do it on time.

Would expanding Medicaid be expensive, and put a strain on state budgets? No, the federal government will pay 90% of the cost until 2020. Some states claim that even the 10% is unbearable, but when you figure in the reduced strain on emergency rooms and public health, expanding Medicaid would most likely save state money, especially with the 90% federal funding.

To really understand why so many states are digging in their heels, I’ve made you a little table. It includes three pieces of information about each state: The first column is whether it accepted Medicaid immediately (“Yes”), accepted it with delays or conditions, or hasn’t officially accepted it yet but is negotiating to do so (“Maybe”), or refused it completely (“No”). The second column is the political party of the state governor. The third column is the majority political party of the state legislatures (“D” for Democrat, “R” for Republican, “I” for Independent, or “M” for mixed if one house has one majority and the other house has the other).

State Medicaid? Governor Legislature
Alabama No R R
Alaska Maybe I R
Arizona Yes R R
Arkansas Maybe R R
California Yes D D
Colorado Yes D M
Connecticut Yes D D
Delaware Yes D D
Florida No R R
Georgia No R R
Hawaii Yes D D
Idaho No R R
Illinois Yes R D
Indiana Maybe R R
Iowa Maybe R M
Kansas No R R
Kentucky Yes R M
Lousiana Maybe D R
Maine No R M
Maryland Yes R D
Massachusetts Yes R D
Michigan Maybe R R
Minnesota No D M
Mississippi No R R
Missouri No D M
Montana Maybe D M
Nebraska No R R
Nevada Yes R R
New Hampshire Maybe D R
New Jersey Yes R D
New Mexico Yes R M
New York Yes D D
North Carolina No R R
North Dakota Yes R R
Ohio Yes R R
Oklahoma No R R
Oregon Yes D D
Pennsylvania Maybe D R
Rhode Island Yes D D
South Carolina No R R
South Dakota Maybe R R
Tennessee No R R
Texas No R R
Utah No R R
Vermont Yes D D
Virginia Maybe D R
Washington Yes D D
West Virginia Yes D R
Wisconsin No R R
Wyoming Maybe R R

I have taken the liberty of some color-coding.

The states highlighted in red are states that refused the Medicaid expansion which have Republican governors and Republican majorities in both legislatures; that’s Alabama, Florida, Georgia, Idaho, Kansas, Mississippi, Nebraska, North Carolina, Oklahoma, South Carolina, Tennessee, Texas, Utah, and Wisconsin.

The states highlighted in purple are states that refused the Medicaid expansion which have mixed party representation between Democrats and Republicans; that’s Maine, Minnesota, and Missouri.

And I would have highlighted in blue the states that refused the Medicaid expansion which have Democrat governors and Democrat majorities in both legislatures—but there aren’t any.

There were Republican-led states which said “Yes” (Arizona, Nevada, North Dakota, and Ohio). There were Republican-led states which said “Maybe” (Arkansas, Indiana, Michigan, South Dakota, and Wyoming).

Mixed states were across the board, some saying “Yes” (Colorado, Illinois, Kentucky, Maryland, Massachusetts, New Jersey, New Mexico, and West Virginia), some saying “Maybe” (Alaska, Iowa, Lousiana, Montana, New Hampshire, Pennsylvania, and Virginia), and a few saying “No” (Maine, Minnesota, and Missouri).

But every single Democrat-led state said “Yes”. California, Connecticut, Delaware, Hawaii, New York, Oregon, Rhode Island, Vermont, and Washington. There aren’t even any Democrat-led states that said “Maybe”.

Perhaps it is simplest to summarize this in another table. Each row is a party configuration (“Democrat, Republican”, or “mixed”); the column is a Medicaid decision (“Yes”, “Maybe”, or “No”); in each cell is the count of how many states that fit that description:

Yes Maybe No
Democrat 9 0 0
Republican 4 5 14
Mixed 8 7 3

Shall I do a chi-square test? Sure, why not? A chi-square test of independence produces a p-value of 0.00001. This is not a coincidence. Being a Republican-led state is strongly correlated with rejecting the Medicaid expansion.

Indeed, because the elected officials were there first, I can say that there is Granger causality from being a Republican-led state to rejecting the Medicaid expansion. Based on the fact that mixed states were much less likely to reject Medicaid than Republican states, I could even estimate a dose-response curve on how having more Republicans makes you more likely to reject Medicaid.

Republicans did this, is basically what I’m getting at here.

Obamacare itself was legitimately controversial (though the Republicans never quite seemed to grasp that they needed a counterproposal for their argument to make sense), but once it was passed, accepting the Medicaid expansion should have been a no-brainer. The federal government is giving you money in order to give healthcare to poor people. It will not be expensive for your state budget; in fact it will probably save you money in the long run. It will help thousands or millions of your constituents. Its impact on the federal budget is negligible.

But no, 14 Republican-led states couldn’t let themselves get caught implementing a Democrat’s policy, especially if it would actually work. If it failed catastrophically, they could say “See? We told you so.” But if it succeeded, they’d have to admit that their opponents sometimes have good ideas. (You know, just like the Democrats did, when they copied most of Mitt Romney’s healthcare system.)

As a result of their stubbornness, almost 3 million Americans don’t have healthcare. Some of those people will die as a result—economists estimate about 7,000 people, to be precise. Hundreds of thousands more will suffer. All needlessly.

When 3,000 people are killed in a terrorist attack, Republicans clamor to kill millions in response with carpet bombing and nuclear weapons.

But when 7,000 people will die without healthcare, Republicans say we can’t afford it.

What happened in Flint?

JDN 2457419

By now you’ve probably heard about the water crisis in Flint, where for almost two years highly dangerous levels of lead were in the city water system, poisoning thousands of people—including over 8,000 children. Many of these children will suffer permanent brain damage. We can expect a crime spike in the area once they get older; reduction in lead exposure may explain as much as half of the decline in crime in the United States—and increase in lead exposure will likely have the opposite effect. At least 10 people have already died.

A state of emergency has now been declared. Governor Snyder of Michigan will be asked to testify in Congress—and what he says had better be good. We have emails showing that he knew about the lead problems as early as February 2015, and as far as we can tell he did absolutely nothing until it all became public.

President Obama has said that the crisis was “inexplicable and inexcusable”. Inexcusable, certainly—but inexplicable? Hardly.

Indeed, this is a taste of the world that Republicans and Libertarians want us to live in, a world where corporations can do whatever they want and get away with it; a world where you can pollute any river, poison any population, and as long as you did it to help rich people get richer no one will stop you.

Every time someone says that our environmental regulations are “too harsh” or “stifle business” or are based on “environmentalist alarmism”, I want you to think of lead in the water in Flint.

Every time someone says that we need to “cut wasteful government spending” and “get government out of the way of business”, I want you to think of lead in the water in Flint.

This was not a natural disaster, a so-called “act of God” beyond human control. This was not some “inexplicable” event beyond our power to predict or understand.

This was a policy decision.

The worst thing about this is that people are taking exactly the wrong lesson. I’ve already seen a meme going around saying “government water/free market water” and showing Flint’s poisoned water next to (supposedly) pristine bottled water. I even saw one tweet with the audacity to assert that teacher pensions were the reason why Flint was so cash-starved that they had no choice but to accept poisoned water. The spin doctors are already at work trying to convince you that this proves that government is the problem and free markets are the solution.

But that is exactly the opposite lesson you should be taking from this.

This was not a case of excessive government intervention. This was a case of total government inaction. This was not the overbearing “nanny state” of social democracy they tell you to fear. This was the passive, ineffectual “starve the beast” government you have been promised by the likes of Reagan.

There were indeed substantial failures by governments at every level. But these failures were always in the form of doing too little, of ignoring the problem; and the original reason why Flint moved away from the municipal water supply was to reduce government spending.

(There were also failures of journalism; but does anyone think this means we should get rid of journalism?)

Nevermind that any sane person would say that clean water should be a top priority, one of the last things you’d even consider cutting spending on. Flint’s government found a way to save a few million dollars (which will now cost several billion to repair—insofar as it is even possible), so they did it. Institutionalized racism very likely contributed to their willingness to sacrifice so many people for so little money (would you poison someone for $100? Snyder and his “emergency manager” Earley apparently would).

I say “they”, and I keep saying the “government” did this; but in fact this was not a government action in the usual sense of a democratically-elected mayor and city council. The decision was made by a so-called “emergency manager”, personally appointed by the Governor and accountable to no one else. This is supposed to be a temporary office to solve emergencies, just like the dictator was in Rome until Julius Caesar decided he didn’t like that “temporary” part. Since it’s basically the same office with the same problems, I suggest we drop the “emergency manager” euphemism and start calling these people what they are—dictators.

This is actually a remarkable First World demonstration of the Sen Hypothesis: Famines don’t occur under democracies, because people who are represented in government don’t allow themselves to be starved. Similarly, people who are represented in government are much less likely to allow their water to be poisoned. It’s not that democratic governments never do anything wrong—but their wrongness is bounded by their accountability to public opinion. Every time we weaken democracy in the name of expediency or “efficiency”, we weaken that barrier against catastrophe.

MoveOn has a petition to impeach Snyder and arrest him on criminal charges. I’ve signed it, and I suggest you do as well. This perversion of democracy and depraved indifference must not stand.

The good news is that humans are altruistic after all, and many people are already doing things to help. You can help, too.

How I wish we measured percentage change

JDN 2457415

For today’s post I’m taking a break from issues of global policy to discuss a bit of a mathematical pet peeve. It is an opinion I share with many economists—for instance Miles Kimball has a very nice post about it, complete with some clever analogies to music.

I hate when we talk about percentages in asymmetric terms.

What do I mean by this? Well, here are a few examples.

If my stock portfolio loses 10% one year and then gains 11% the following year, have I gained or lost money? I’ve lost money. Only a little bit—I’m down 0.1%—but still, a loss.

In 2003, Venezuela suffered a depression of -26.7% growth one year, and then an economic boom of 36.1% growth the following year. What was their new GDP, relative to what it was before the depression? Very slightly less than before. (99.8% of its pre-recession value, to be precise.) You would think that falling 27% and rising 36% would leave you about 9% ahead; in fact it leaves you behind.

Would you rather live in a country with 11% inflation and have constant nominal pay, or live in a country with no inflation and take a 10% pay cut? You should prefer the inflation; in that case your real income only falls by 9.9%, instead of 10%.

We often say that the real interest rate is simply the nominal interest rate minus the rate of inflation, but that’s actually only an approximation. If you have 7% inflation and a nominal interest rate of 11%, your real interest rate is not actually 4%; it is 3.74%. If you have 2% inflation and a nominal interest rate of 0%, your real interest rate is not actually -2%; it is -1.96%.

This is what I mean by asymmetric:

Rising 10% and falling 10% do not cancel each other out. To cancel out a fall of 10%, you must actually rise 11.1%.

Gaining 20% and losing 20% do not cancel each other out. To cancel out a loss of 20%, you need a gain of 25%.

Is it starting to bother you yet? It sure bothers me.

Worst of all is the fact that the way we usually measure percentages, losses are bounded at 100% while gains are unbounded. To cancel a loss of 100%, you’d need a gain of infinity.

There are two basic ways of solving this problem: The simple way, and the good way.

The simple way is to just start measuring percentages symmetrically, by including both the starting and ending values in the calculation and averaging them.
That is, instead of using this formula:

% change = 100% * (new – old)/(old)

You use this one:

% change = 100% * (new – old)/((new + old)/2)

In this new system, percentage changes are symmetric.

Suppose a country’s GDP rises from $5 trillion to $6 trillion.

In the old system we’d say it has risen 20%:

100% * ($6 T – $5 T)/($5 T) = 20%

In the symmetric system, we’d say it has risen 18.2%:

100% * ($6 T – $5 T)/($5.5 T) = 18.2%

Suppose it falls back to $5 trillion the next year.

In the old system we’d say it has only fallen 16.7%:

100% * ($5 T – $6 T)/($6 T) = -16.7%

But in the symmetric system, we’d say it has fallen 18.2%.

100% * ($5 T – $6 T)/($5.5 T) = -18.2%

In the old system, the gain of 20% was somehow canceled by a loss of 16.7%. In the symmetric system, the gain of 18.2% was canceled by a loss of 18.2%, just as you’d expect.

This also removes the problem of losses being bounded but gains being unbounded. Now both losses and gains are bounded, at the rather surprising value of 200%.

Formally, that’s because of these limits:
lim_{x rightarrow infty} {(x-1) over {(x+1)/2}} = 2

lim_{x rightarrow infty} {(0-x) over {(x+0)/2}} = -2

It might be easier to intuit these limits with an example. Suppose something explodes from a value of 1 to a value of 10,000,000. In the old system, this means it rose 1,000,000,000%. In the symmetric system, it rose 199.9999%. Like the speed of light, you can approach 200%, but never quite get there.

100% * (10^7 – 1)/(5*10^6 + 0.5) = 199.9999%

Gaining 200% in the symmetric system is gaining an infinite amount. That’s… weird, to say the least. Also, losing everything is now losing… 200%?

This is simple to explain and compute, but it’s ultimately not the best way.

The best way is to use logarithms.

As you may vaguely recall from math classes past, logarithms are the inverse of exponents.

Since 2^4 = 16, log_2 (16) = 4.

The natural logarithm ln() is the most fundamental for deep mathematical reasons I don’t have room to explain right now. It uses the base e, a transcendental number that starts 2.718281828459045…

To the uninitiated, this probably seems like an odd choice—no rational number has a natural logarithm that is itself a rational number (well, other than 1, since ln(1) = 0).

But perhaps it will seem a bit more comfortable once I show you that natural logarithms are remarkably close to percentages, particularly for the small changes in which percentages make sense.

We define something called log points such that the change in log points is 100 times the natural logarithm of the ratio of the two:

log points = 100 * ln(new / old)

This is symmetric because of the following property of logarithms:

ln(a/b) = – ln(b/a)

Let’s return to the country that saw its GDP rise from $5 trillion to $6 trillion.

The logarithmic change is 18.2 log points:

100 * ln($6 T / $5 T) = 100 * ln(1.2) = 18.2

If it falls back to $5 T, the change is -18.2 log points:

100 * ln($5 T / $6 T) = 100 * ln(0.833) = -18.2

Notice how in the symmetric percentage system, it rose and fell 18.2%; and in the logarithmic system, it rose and fell 18.2 log points. They are almost interchangeable, for small percentages.

In this graph, the old value is assumed to be 1. The horizontal axis is the new value, and the vertical axis is the percentage change we would report by each method.

percentage_change_small

The green line is the usual way we measure percentages.

The red curve is the symmetric percentage method.

The blue curve is the logarithmic method.

For percentages within +/- 10%, all three methods are about the same. Then both new methods give about the same answer all the way up to changes of +/- 40%. Since most real changes in economics are within that range, the symmetric method and the logarithmic method are basically interchangeable.

However, for very large changes, even these two methods diverge, and in my opinion the logarithm is to be preferred.

percentage_change_large

The symmetric percentage never gets above 200% or below -200%, while the logarithm is unbounded in both directions.

If you lose everything, the old system would say you have lost 100%. The symmetric system would say you have lost 200%. The logarithmic system would say you have lost infinity log points. If infinity seems a bit too extreme, think of it this way: You have in fact lost everything. No finite proportional gain can ever bring it back. A loss that requires a gain of infinity percent seems like it should be called a loss of infinity percent, doesn’t it? Under the logarithmic system it is.

If you gain an infinite amount, the old system would say you have gained infinity percent. The logarithmic system would also say that you have gained infinity log points. But the symmetric percentage system would say that you have gained 200%. 200%? Counter-intuitive, to say the least.

Log points also have another very nice property that neither the usual system nor the symmetric percentage system have: You can add them.

If you gain 25 log points, lose 15 log points, then gain 10 log points, you have gained 20 log points.

25 – 15 + 10 = 20

Just as you’d expect!

But if you gain 25%, then lose 15%, and then gain 10%, you have gained… 16.9%.

(1 + 0.25)*(1 – 0.15)*(1 + 0.10) = 1.169

If you gain 25% symmetric, lose 15% symmetric, then gain 10% symmetric, that calculation is really a pain. To find the value y that is p symmetric percentage points from the starting value x, you end up needing to solve this equation:

p = 100 * (y – x)/((x+y)/2)

This can be done; it comes out like this:

y = (200 + p)/(200 – p) * x

(This also gives a bit of insight into why it is that the bounds are +/- 200%.)

So by chaining those, we can in fact find out what happens after gaining 25%, losing 15%, then gaining 10% in the symmetric system:

(200 + 25)/(200 – 25)*(200 – 15)/(200 + 15)*(200 + 10)/(200 – 10) = 1.223

Then we can put that back into the symmetric system:

100% * (1.223 – 1)/((1+1.223)/2) = 20.1%

So after all that work, we find out that you have gained 20.1% symmetric. We could almost just add them—because they are so similar to log points—but we can’t quite.

Log points actually turn out to be really convenient, once you get the hang of them. The problem is that there’s a conceptual leap for most people to grasp what a logarithm is in the first place.

In particular, the hardest part to grasp is probably that a doubling is not 100 log points.

It is in fact 69 log points, because ln(2) = 0.69.

(Doubling in the symmetric percentage system is gaining 67%—much closer to the log points than to the usual percentage system.)

Calculation of the new value is a bit more difficult than in the usual system, but not as difficult as in the symmetric percentage system.

If you have a change of p log points from a starting point of x, the ending point y is:

y = e^{p/100} * x

The fact that you can add log points ultimately comes from the way exponents add:

e^{p1/100} * e^{p2/100} = e^{(p1+p2)/100}

Suppose US GDP grew 2% in 2007, then 0% in 2008, then fell 8% in 2009 and rose 4% in 2010 (this is approximately true). Where was it in 2010 relative to 2006? Who knows, right? It turns out to be a net loss of 2.4%; so if it was $15 T before it’s now $14.63 T. If you had just added, you’d think it was only down 2%; you’d have underestimated the loss by $70 billion.

But if it had grown 2 log points, then 0 log points, then fell 8 log points, then rose 4 log points, the answer is easy: It’s down 2 log points. If it was $15 T before, it’s now $14.70 T. Adding gives the correct answer this time.

Thus, instead of saying that the stock market fell 4.3%, we should say it fell 4.4 log points. Instead of saying that GDP is up 1.9%, we should say it is up 1.8 log points. For small changes it won’t even matter; if inflation is 1.4%, it is in fact also 1.4 log points. Log points are a bit harder to conceptualize; but they are symmetric and additive, which other methods are not.

Is this a matter of life and death on a global scale? No.

But I can’t write about those every day, now can I?

Why is it so hard to get a job?

JDN 2457411

The United States is slowly dragging itself out of the Second Depression.

Unemployment fell from almost 10% to about 5%.

Core inflation has been kept between 0% and 2% most of the time.

Overall inflation has been within a reasonable range:

US_inflation

Real GDP has returned to its normal growth trend, though with a permanent loss of output relative to what would have happened without the Great Recession.

US_GDP_growth

Consumption spending is also back on trend, tracking GDP quite precisely.

The Federal Reserve even raised the federal funds interest rate above the zero lower bound, signaling a return to normal monetary policy. (As I argued previously, I’m pretty sure that was their main goal actually.)

Employment remains well below the pre-recession peak, but is now beginning to trend upward once more.

The only thing that hasn’t recovered is labor force participation, which continues to decline. This is how we can have unemployment go back to normal while employment remains depressed; people leave the labor force by retiring, going back to school, or simply giving up looking for work. By the formal definition, someone is only unemployed if they are actively seeking work. No, this is not new, and it is certainly not Obama rigging the numbers. This is how we have measured unemployment for decades.

Actually, it’s kind of the opposite: Since the Clinton administration we’ve also kept track of “broad unemployment”, which includes people who’ve given up looking for work or people who have some work but are trying to find more. But we can’t directly compare it to anything that happened before 1994, because the BLS didn’t keep track of it before then. All we can do is estimate based on what we did measure. Based on such estimation, it is likely that broad unemployment in the Great Depression may have gotten as high as 50%. (I’ve found that one of the best-fitting models is actually one of the simplest; assume that broad unemployment is 1.8 times narrow unemployment. This fits much better than you might think.)

So, yes, we muddle our way through, and the economy eventually heals itself. We could have brought the economy back much sooner if we had better fiscal policy, but at least our monetary policy was good enough that we were spared the worst.

But I think most of us—especially in my generation—recognize that it is still really hard to get a job. Overall GDP is back to normal, and even unemployment looks all right; but why are so many people still out of work?

I have a hypothesis about this: I think a major part of why it is so hard to recover from recessions is that our system of hiring is terrible.

Contrary to popular belief, layoffs do not actually substantially increase during recessions. Quits are substantially reduced, because people are afraid to leave current jobs when they aren’t sure of getting new ones. As a result, rates of job separation actually go down in a recession. Job separation does predict recessions, but not in the way most people think. One of the things that made the Great Recession different from other recessions is that most layoffs were permanent, instead of temporary—but we’re still not sure exactly why.

Here, let me show you some graphs from the BLS.

This graph shows job openings from 2005 to 2015:

job_openings

This graph shows hires from 2005 to 2015:

job_hires

Both of those show the pattern you’d expect, with openings and hires plummeting in the Great Recession.

But check out this graph, of job separations from 2005 to 2015:

job_separations

Same pattern!

Unemployment in the Second Depression wasn’t caused by a lot of people losing jobs. It was caused by a lot of people not getting jobs—either after losing previous ones, or after graduating from school. There weren’t enough openings, and even when there were openings there weren’t enough hires.

Part of the problem is obviously just the business cycle itself. Spending drops because of a financial crisis, then businesses stop hiring people because they don’t project enough sales to justify it; then spending drops even further because people don’t have jobs, and we get caught in a vicious cycle.

But we are now recovering from the cyclical downturn; spending and GDP are back to their normal trend. Yet the jobs never came back. Something is wrong with our hiring system.

So what’s wrong with our hiring system? Probably a lot of things, but here’s one that’s been particularly bothering me for a long time.
As any job search advisor will tell you, networking is essential for career success.

There are so many different places you can hear this advice, it honestly gets tiring.

But stop and think for a moment about what that means. One of the most important determinants of what job you will get is… what people you know?

It’s not what you are best at doing, as it would be if the economy were optimally efficient.
It’s not even what you have credentials for, as we might expect as a second-best solution.

It’s not even how much money you already have, though that certainly is a major factor as well.

It’s what people you know.

Now, I realize, this is not entirely beyond your control. If you actively participate in your community, attend conferences in your field, and so on, you can establish new contacts and expand your network. A major part of the benefit of going to a good college is actually the people you meet there.

But a good portion of your social network is more or less beyond your control, and above all, says almost nothing about your actual qualifications for any particular job.

There are certain jobs, such as marketing, that actually directly relate to your ability to establish rapport and build weak relationships rapidly. These are a tiny minority. (Actually, most of them are the sort of job that I’m not even sure needs to exist.)

For the vast majority of jobs, your social skills are a tiny, almost irrelevant part of the actual skill set needed to do the job well. This is true of jobs from writing science fiction to teaching calculus, from diagnosing cancer to flying airliners, from cleaning up garbage to designing spacecraft. Social skills are rarely harmful, and even often provide some benefit, but if you need a quantum physicist, you should choose the recluse who can write down the Dirac equation by heart over the well-connected community leader who doesn’t know what an integral is.

At the very least, it strains credibility to suggest that social skills are so important for every job in the world that they should be one of the defining factors in who gets hired. And make no mistake: Networking is as beneficial for landing a job at a local bowling alley as it is for becoming Chair of the Federal Reserve. Indeed, for many entry-level positions networking is literally all that matters, while advanced positions at least exclude candidates who don’t have certain necessary credentials, and then make the decision based upon who knows whom.

Yet, if networking is so inefficient, why do we keep using it?

I can think of a couple reasons.

The first reason is that this is how we’ve always done it. Indeed, networking strongly pre-dates capitalism or even money; in ancient tribal societies there were certainly jobs to assign people to: who will gather berries, who will build the huts, who will lead the hunt. But there were no colleges, no certifications, no resumes—there was only your position in the social structure of the tribe. I think most people simply automatically default to a networking-based system without even thinking about it; it’s just the instinctual System 1 heuristic.

One of the few things I really liked about Debt: The First 5000 Years was the discussion of how similar the behavior of modern CEOs is to that of ancient tribal chieftans, for reasons that make absolutely no sense in terms of neoclassical economic efficiency—but perfect sense in light of human evolution. I wish Graeber had spent more time on that, instead of many of these long digressions about international debt policy that he clearly does not understand.

But there is a second reason as well, a better reason, a reason that we can’t simply give up on networking entirely.

The problem is that many important skills are very difficult to measure.

College degrees do a decent job of assessing our raw IQ, our willingness to persevere on difficult tasks, and our knowledge of the basic facts of a discipline (as well as a fantastic job of assessing our ability to pass standardized tests!). But when you think about the skills that really make a good physicist, a good economist, a good anthropologist, a good lawyer, or a good doctor—they really aren’t captured by any of the quantitative metrics that a college degree provides. Your capacity for creative problem-solving, your willingness to treat others with respect and dignity; these things don’t appear in a GPA.

This is especially true in research: The degree tells how good you are at doing the parts of the discipline that have already been done—but what we really want to know is how good you’ll be at doing the parts that haven’t been done yet.

Nor are skills precisely aligned with the content of a resume; the best predictor of doing something well may in fact be whether you have done so in the past—but how can you get experience if you can’t get a job without experience?

These so-called “soft skills” are difficult to measure—but not impossible. Basically the only reliable measurement mechanisms we have require knowing and working with someone for a long span of time. You can’t read it off a resume, you can’t see it in an interview (interviews are actually a horribly biased hiring mechanism, particularly biased against women). In effect, the only way to really know if someone will be good at a job is to work with them at that job for awhile.

There’s a fundamental information problem here I’ve never quite been able to resolve. It pops up in a few other contexts as well: How do you know whether a novel is worth reading without reading the novel? How do you know whether a film is worth watching without watching the film? When the information about the quality of something can only be determined by paying the cost of purchasing it, there is basically no way of assessing the quality of things before we purchase them.

Networking is an attempt to get around this problem. To decide whether to read a novel, ask someone who has read it. To decide whether to watch a film, ask someone who has watched it. To decide whether to hire someone, ask someone who has worked with them.

The problem is that this is such a weak measure that it’s not much better than no measure at all. I often wonder what would happen if businesses were required to hire people based entirely on resumes, with no interviews, no recommendation letters, and any personal contacts treated as conflicts of interest rather than useful networking opportunities—a world where the only thing we use to decide whether to hire someone is their documented qualifications. Could it herald a golden age of new economic efficiency and job fulfillment? Or would it result in widespread incompetence and catastrophic collapse? I honestly cannot say.

How Reagan ruined America

JDN 2457408

Or maybe it’s Ford?

The title is intentionally hyperbolic; despite the best efforts of Reagan and his ilk, America does yet survive. Indeed, as Obama aptly pointed out in his recent State of the Union, we appear to be on an upward trajectory once more. And as you’ll see in a moment, many of the turning points actually seem to be Gerald Ford, though it was under Reagan that the trends really gained steam.

But I think it’s quite remarkable just how much damage Reaganomics did to the economy and society of the United States. It’s actually a turning point in all sorts of different economic policy measures; things were going well from the 1940s to the 1970s, and then suddenly in the 1980s they take a turn for the worse.

The clearest example is inequality. From the World Top Incomes Database, here’s the graph I featured on my Patreon page of income shares in the United States:

top_income_shares_pretty.png

Inequality was really bad during the Roaring Twenties (no surprise to anyone who has read The Great Gatsby), then after the turmoil of the Great Depression, the New Deal, and World War 2, inequality was reduced to a much lower level.

During this period, what I like to call the Golden Age of American Capitalism:

Instead of almost 50% in the 1920s, the top 10% now received about 33%.

Instead of over 20% in the 1920s, the top 1% now received about 10%.

Instead of almost 5% in the 1920s, the top 0.01% now received about 1%.

This pattern continued to hold, remarkably stable, until 1980. Then, it completely unraveled. Income shares of the top brackets rose, and continued to rise, ever since (fluctuating with the stock market of course). Now, we’re basically back right where we were in the 1920s; the top 10% gets 50%, the top 1% gets 20%, and the top 0.01% gets 4%.

Not coincidentally, we see the same pattern if we look at the ratio of CEO pay to average worker pay, as shown here in a graph from the Economic Policy Institute:

Snapshot_CEO_pay_main

Up until 1980, the ratio in pay between CEOs and their average workers was steady around 20 to 1. From that point forward, it began to rise—and rise, and rise. It continued to rise under every Presidential administration, and actually hit its peak in 2000, under Bill Clinton, at an astonishing 411 to 1 ratio. In the 2000s it fell to about 250 to 1 (hurray?), and has slightly declined since then to about 230 to 1.

By either measure, we can see a clear turning point in US inequality—it was low and stable, until Reagan came along, when it began to explode.

Part of this no doubt is the sudden shift in tax rates. The top marginal tax rates on income were over 90% from WW2 to the 1960s; then JFK reduced them to 70%, which is probably close to the revenue-maximizing rate. There they stayed, until—you know the refrain—along came Reagan, and by the end of his administration he had dropped the top marginal rate to 28%. It then was brought back up to about 35%, where it has basically remained, sometimes getting as high as 40%.

US_income_tax_rates

Another striking example is the ratio between worker productivity and wages. The Economic Policy Institute has a very detailed analysis of this, but I think their graph by itself is quite striking:

productivity_wages

Starting around the 1970s, and then rapidly accelerating from the 1980s onward, we see a decoupling of productivity from wages. Productivity has continued to rise at more or less the same rate, but wages flatten out completely, even falling for part of the period.

For those who still somehow think Republicans are fiscally conservative, take a look at this graph of the US national debt:

US_federal_debt

We were at a comfortable 30-40% of GDP range, actually slowly decreasing—until Reagan. We got back on track to reduce the debt during the mid-1990s—under Bill Clinton—and then went back to raising it again once George W. Bush got in office. It ballooned as a result of the Great Recession, and for the past few years Obama has been trying to bring it back under control.

Of course, national debt is not nearly as bad as most people imagine it to be. If Reagan had only raised the national debt in order to stop unemployment, that would have been fine—but he did not.

Unemployment had never been above 10% since World War 2 (and in fact reached below 4% in the 1960s!) and yet all the sudden hit almost 11%, shortly after Reagan:
US_unemployment
Let’s look at that graph a little closer. Right now the Federal Reserve uses 5% as their target unemployment rate, the supposed “natural rate of unemployment” (a lot of economists use this notion, despite there being almost no empirical support for it whatsoever). If I draw red lines at 5% unemployment and at 1981, the year Reagan took office, look at what happens.

US_unemployment_annotated

For most of the period before 1981, we spent most of our time below the 5% line, jumping above it during recessions and then coming back down; for most of the period after 1981, we spent most of our time above the 5% line, even during economic booms.

I’ve drawn another line (green) where the most natural break appears, and it actually seems to be the Ford administration; so maybe I can’t just blame Reagan. But something happened in the last quarter of the 20th century that dramatically changed the shape of unemployment in America.

Inflation is at least ambiguous; it was pretty bad in the 1940s and 1950s, and then settled down in the 1960s for awhile before picking up in the 1970s, and actually hit its worst just before Reagan took office:

US_inflation

Then there’s GDP growth.

US_GDP_growth

After World War 2, our growth rate was quite volatile, rising as high as 8% (!) in some years, but sometimes falling to zero or slightly negative. Rates over 6% were common during booms. On average GDP growth was quite good, around 4% per year.

In 1981—the year Reagan took office—we had the worst growth rate in postwar history, an awful -1.9%. Coming out of that recession we had very high growth of about 7%, but then settled into the new normal: More stable growth rates, yes, but also much lower. Never again did our growth rate exceed 4%, and on average it was more like 2%. In 2009, Reagan’s record recession was broken with the Great Recession, a drop of almost 3% in a single year.

GDP per capita tells a similar story, of volatile but fast growth before Reagan followed by stable but slow growth thereafter:

US_GDP_per_capita

Of course, it wouldn’t be fair to blame Reagan for all of this. A lot of things have happened in the late 20th century, after all. In particular, the OPEC oil crisis is probably responsible for many of these 1970s shocks, and when Nixon moved us at last off the Bretton Woods gold standard, it was probably the right decision, but done at a moment of crisis instead of as the result of careful planning.

Also, while the classical gold standard was terrible, the Bretton Woods system actually had some things to recommend it. It required strict capital controls and currency exchange regulations, but the period of highest economic growth and lowest inequality in the United States—the period I’m calling the Golden Age of American Capitalism—was in fact the same period as the Bretton Woods system.

Some of these trends started before Reagan, and all of them continued in his absence—many of them worsening as much or more under Clinton. Reagan took office during a terrible recession, and either contributed to the recovery or at least did not prevent it.

The President only has very limited control over the economy in any case; he can set a policy agenda, but Congress must actually implement it, and policy can take years to show its true effects. Yet given Reagan’s agenda of cutting top tax rates, crushing unions, and generally giving large corporations whatever they want, I think he bears at least some responsibility for turning our economy in this very bad direction.

The challenges of a global basic income

JDN 2457404

In the previous post I gave you the good news. Now for the bad news.

So we are hoping to implement a basic income of $3,000 per person per year worldwide, eliminating poverty once and for all.

There is no global government to implement this system. There is no global income tax to be collected or refunded. The United Nations and the World Bank, for all the good work that they do, are nowhere near powerful enough (or well-funded enough) to accomplish this feat.

Worse, the people we need to help the most, not coincidentally, live in the countries that are worst-managed. They are surrounded not only by squalor, but also by corruption, war, ethnic tension. Most of the people are underfed, uneducated, and dying from diseases such as malaria and schistomoniasis that we could treat in a day for pocket change. Their infrastructure is either crumbling or nonexistent. Their water is unsafe to drink. And worst of all, many of their governments don’t care. Tyrants like Robert Mugabe, Kim Jong-un, King Salman (of our lovely ally Saudi Arabia), and Isayas Afewerki care nothing for the interests of the people they rule, and are interested only in maximizing their own wealth and power. If we arranged to provide grants to these countries in an amount sufficient to provide the basic income, there’s no reason to think they’d actually provide it; they’d simply deposit the check in their own personal bank accounts, and use it to buy ever more extravagant mansions or build ever greater monuments to themselves. They really do seem to follow a utility function based entirely upon their own consumption; witness your neoclassical rational agent and despair.

There are ways for international institutions and non-governmental organizations to intervene to help people in these countries, and indeed many have done so to considerable effect. As bad as things are, they are much better than they used to be, and they promise to be even better tomorrow. But there is only so much they can do without the force of law at their backs, without the power to tax incomes and print currency.

We will therefore need a new kind of institutional framework, if not a true world government then something very much like it. Establishing this new government will not be easy, and worst of all I see no way to do it other than military force. Tyrants will not give up their power willingly; it will need to be taken from them. We will need to capture and imprison tyrants like Robert Mugabe and Kim Jong Un in the same way that we once did to mob bosses like John Dillinger and Al Capone, for ultimately a tyrant is nothing but a mob boss with an army.Unless we can find some way to target them precisely and smoothly replace their regimes with democracies, this will mean nothing less than war, and it could kill thousands, even millions of people—but millions of people are already dying, and will continue to die as long as we leave these men in power. Sanctions might help (though sanctions kill people too), and perhaps a few can be persuaded to step down, but the rest must be overthrown, by some combination of local revolutions and international military coalitions. The best model I’ve seen for how this might be pulled off is Libya, where Qaddafi was at last removed by an international military force supporting a local revolution—but even Libya is not exactly sunshine and rainbows right now. One of the first things we need to do is seriously plan a strategy for removing repressive dictators with a minimum of collateral damage.

To many, I suspect this sounds like imperialism, colonialism redux. Didn’t so many imperialistic powers say that they were doing it to help the local population? Yes, they did; and one of the facts that we must face up to is that it was occasionally true. Or if helping the local population was not their primary motivation, it was nonetheless a consequence. Countries colonized by the British Empire in particular are now the most prosperous, free nations in the world: The United States, Canada, Australia. South Africa and India might seem like exceptions (GDP PPP per capita of $12,400 and $5,500 respectively) but they really aren’t, compared to what they were before—or even compared to what is next to them today: Angola has a per capita GDP PPP of $7,546 while Bangladesh has only $2,991. Zimbabwe is arguably an exception (per capita GDP PPP of $1,773), but their total economic collapse occurred after the British left. To include Zimbabwe in this basic income program would literally triple the income of most of their population. But to do that, we must first get through Robert Mugabe.

Furthermore, I believe that we can avoid many of the mistakes of the past. We don’t have to do exactly the same thing that countries used to do when they invaded each other and toppled governments. Of course we should not enslave, subjugate, or murder the local population—one would hope that would go without saying, but history shows it doesn’t. We also shouldn’t annex the territory and claim it as our own, nor should we set up puppet governments that are only democratic as long as it serves our interests. (And make no mistake, we have done this, all too recently.) The goal must really be to help the people of countries like Zimbabwe and Eritrea establish their own liberal democracy, including the right to make policies we don’t like—or even policies we think are terrible ideas. If we can do so without war, of course we should. But right now what is usually called “pacifism” leaves millions of people to starve while we do nothing.

The argument that we have previously supported (or even continue to support, ahem, Saudi Arabia) many of these tyrants is sort of beside the point. Yes, that is clearly true; and yes, that is clearly terrible. But do you think that if we simply leave the situation alone they’ll go away? We should never have propped up Saddam Hussein or supported the mujihadeen who became the Taliban; and yes, I do think we could have known that at the time. But once they are there, what do you propose to do now? Wait for them to die? Hope they collapse on their own? Give our #thoughtsandprayers to revolutionaries? When asked what you think we should do, “We shouldn’t have done X” is not a valid response.

Imagine there is a mob boss who had kidnapped several families and is holding them in a warehouse. Suppose that at some point the police supported the mob boss in some way; in a deal to undermine a worse rival mafia family, they looked the other way on some things he did, or even gave him money that he used to strengthen his mob. (With actual police, the former is questionable, but actually done all the time; the latter would be definitely illegal. In the international analogy, both are ubiquitous.) Even suppose that the families who were kidnapped were previously from a part of town that the police would regularly shake down for petty crimes and incessant stop-and-frisks. The police definitely have a lot to answer for in all this; their crimes should not be forgotten. But how does it follow in any way that the police should not intervene to rescue the families from the warehouse? Suppose we even know that the warehouse is heavily guarded, and the resulting firefight may kill some of the hostages we are hoping to save. This gives us reason to negotiate, or to find the swiftest, most precise means to deploy the SWAT teams; but does it give us reason to do nothing?

Once again I think Al Capone is the proper analogy; when the FBI captured Al Capone, they didn’t bomb Chicago to the ground, nor did they attempt to enslave the population of Illinois. They thought of themselves as targeting one man and his lieutenants and re-establishing order and civil government to a free people; that is what we must do in Eritrea and Zimbabwe. (In response to all this, no doubt someone will say: “You just want the US to be the world’s police.” Well, no, I want an international coalition; but yes, given our military and economic hegemony, the US will take a very important role. Above all, yes, I want the world to have police. Why don’t you?)

For everything we did wrong in the recent wars in Afghanistan and Iraq, I think we actually did this part right: Afghanistan’s GDP PPP per capita has risen over 70% since 2002, and Iraq’s is now 17% higher than its pre-war peak. It’s a bit early to say whether we have really established stable liberal democracies there, and the Iraq War surely contributed to the rise of Daesh; but when the previous condition was the Taliban and Saddam Hussein it’s hard not to feel that things are at least somewhat improving. In a generation or two maybe we really will say “Iraq” in the same breath as “Korea” as one of the success stories of prosperous democracies set up after US wars. Or maybe it will all fall apart; it’s hard to say at this point.

So, we must find a way to topple the tyrants. Once that is done, we will need to funnel huge amounts of resources—at least one if not two orders of magnitude larger than our current level of foreign aid into building infrastructure, educating people, and establishing sound institutions. Our current “record high” foreign aid is less than 0.3% of world’s GDP. We have a model for this as well: It’s what we did in West Germany and Japan after WW2, as well as what we did in South Korea after the Korean War. It is not a coincidence that Germany soon regained its status as a world power while Japan and Korea were the first of the “Asian Tigers”, East Asian nations that rose up to join us at a First World standard of living.

Will all of this be expensive? Absolutely. By assuming $3,000 per person per year I am already figuring in an expenditure of $21 trillion per year, indefinitely. This would be the most expensive project upon which humanity has ever embarked. But it could also be the most important—an end to poverty, everywhere, forever. And we have that money, we’re simply using it for other things. At purchasing power parity the world spends over $100 trillion per year. Using 20% of the world’s income to eliminate poverty forever doesn’t seem like such a bad deal to me. (It’s not like it would disappear; it would be immediately spent back into the economy anyway. We might even see growth as a result.)

When dealing with events on this scale, it’s easy to get huge numbers that sound absurd. But even if we assumed that only the US, Europe, and China supported this program, it would only take 37% of our combined income—roughly what we currently spend on housing.

Whenever people complain, “We spend billions of dollars a year on aid, and we haven’t solved world hunger!” the proper answer is, “That’s right; we should be spending trillions.”

The possibilities of a global basic income

JDN 2457401

This post is sort of a Patreon Readers’ Choice; it had a tied score with the previous post. If ties keep happening, I may need to devise some new scheme, lest I end up writing so many Readers’ Choice posts I don’t have time for my own topics (I suppose there are worse fates).

The idea of a global basic income is one I have alluded to many times, but never directly focused on.

As I wrote this I realized it’s actually two posts. I have good news and bad news.
First, the good news.

A national basic income is a remarkably simple, easy policy to make: When the tax code comes around for revision that year, you get Congress to vote in a very large refundable credit, disbursed monthly, that goes to everyone—that is a basic income. To avoid ballooning the budget deficit, you would also want to eliminate a bunch of other deductions and credits, and might want to raise the tax rates as well—but these are all things that we have done before many times. Different administrations almost always add some deductions and remove others, raise some rates and lower others. By this simple intervention, we could end poverty in America immediately and forever. The most difficult part of this whole process is convincing a majority of both houses of Congress to support it. (And even that may not be as difficult as it seems, for a basic income is one of the few economic policies that appeals to both Democrats, Libertarians, and even some Republicans.)

Similar routine policy changes could be applied in other First World countries. A basic income could be established by a vote of Parliament in the UK, a vote of the Senate and National Assembly in France, a vote of the Riksdag in Sweden, et cetera; indeed, Switzerland is already planning a referendum on the subject this year. The benefits of a national basic income policy are huge, the costs are manageable, the implementation is trivial. Indeed, the hardest thing to understand about all of this is why we haven’t done it already.

But the benefits of a national basic income are of course limited to the nation(s) in which it is applied. If Switzerland votes in its proposal to provide $30,000 per person per year (that’s at purchasing power parity, but it’s almost irrelevant whether I use nominal or PPP figures, because Swiss prices are so close to US prices), that will help a lot of people in Switzerland—but it won’t do much for people in Germany or Italy, let alone people in Ghana or Nicaragua. It could do a little bit for other countries, if the increased income for the poor and lower-middle class results in increased imports to Switzerland. But Switzerland especially is a very small player in global trade. A US basic income is more likely to have global effects, because the US by itself accounts for 9% of the world’s exports and 13% of the world’s imports. Some nations, particularly in Latin America, depend almost entirely upon the US to buy their exports.

But even so, national basic incomes in the entire First World would not solve the problem of global poverty. To do that, we would need a global basic income, one that applies to every human being on Earth.

The first question to ask is whether this is feasible at all. Do we even have enough economic output in the world to do this? If we tried would we simply trigger a global economic collapse?

Well,if you divide all the world’s income, adjusted for purchasing power, evenly across all the world’s population, the result is about $15,000 per person per year. This is about the standard of living of the average (by which I mean median) person in Lebanon, Brazil, or Botswana. It’s a little better than the standard of living in China, South Africa, or Peru. This is about half of what the middle class of the First World are accustomed to, but it is clearly enough to not only survive, but actually make some kind of decent living. I think most people would be reasonably happy with this amount of income, if it were stable and secure—and by construction, the majority of the world’s population would be better off if all incomes were equalized in this way.

Of course, we can’t actually do that. All the means we have for redistributing income to that degree would require sacrificing economic efficiency in various ways. It is as if we were carrying water in buckets with holes in the bottom; the amount we give at the end is a lot less than the amount we took at the start.

Indeed, the efficiency costs of redistribution rise quite dramatically as the amount redistributed increases.

I have yet to see a convincing argument for why we could not simply tax the top 1% at a 90% marginal rate and use all of that income for public goods without any significant loss in economic efficiency—this is after all more or less what we did here in the United States in the 1960s, when we had a top marginal rate over 90% and yet per capita GDP growth was considerably higher than it is today. A great many economists seem quite convinced that taxing top incomes in this way would create some grave disincentive against innovation and productivity, yet any time anything like this has been tried such disincentives have conspicuously failed to emerge. (Why, it’s almost as if the rich aren’t that much smarter and more hard-working than we are!)

I am quite sure, on the other hand, that if we literally set up the tax system so that all income gets collected by the government and then doled out to everyone evenly, this would be economically disastrous. Under that system, your income is basically independent of the work you do. You could work your entire life to create a brilliant invention that adds $10 billion to the world economy, and your income would rise by… 0.01%, the proportion that your invention added to the world economy. Or you could not do that, indeed do nothing at all, be a complete drain upon society, and your income would be about $1.50 less each year. It’s not hard to understand why a lot of people might work considerably less hard in such circumstances; if you are paid exactly the same whether you are an entrepreneur, a software engineer, a neurosurgeon, a teacher, a garbage collector, a janitor, a waiter, or even simply a couch potato, it’s hard to justify spending a lot of time and effort acquiring advanced skills and doing hard work. I’m sure there are some people, particularly in creative professions such as art, music, and writing—and indeed, science—who would continue to work, but even so the garbage would not get picked up, the hamburgers would never get served, and the power lines would never get fixed. The result would be that trying to give everyone the same income would dramatically reduce the real income available to distribute, so that we all ended up with say $5,000 per year or even $1,000 per year instead of $15,000.

Indeed, absolute equality is worse than the system of income distribution under Soviet Communism, which still provided at least some incentives to work—albeit often not to work in the most productive or efficient way.

So let’s suppose that we only have the income of the top 1% to work with. It need not be literally that we take income only from the top 1%; we could spread the tax burden wider than that, and there may even be good reasons to do so. But I think this gives us a good back-of-the-envelope estimate of how much money we would realistically have to work with in funding a global basic income. It’s actually surprisingly hard to find good figures on the global income share of the top 1%; there’s one figure going around which is not simply wrong it’s ridiculous, claiming that the income threshold for the top 1% worldwide is only $34,000. Why is it ridiculous? Because the United States comprises 4.5% of the world’s population, and half of Americans make more money than that. This means that we already have at least 2% of the world’s population making at least that much, in the United States alone. Add in people from Europe, Japan, etc. and you easily find that this must be the income of about the top 5%, maybe even only the top 10%, worldwide. Exactly where it lies depends on the precise income distributions of various countries.

But here’s what I do know; the global Gini coefficient is about 0.40, and the US Gini coefficient is about 0.45; thus, roughly speaking, income inequality on a global scale recapitulates income inequality in the US. The top 1% in the US receive about 20% of the income. So let’s say that the top 1% worldwide probably also receive somewhere around 20% of the income. We were only using it to estimate the funds available for a basic income anyway.

This would mean that our basic income could be about $3,000 per person per year at purchasing power parity. That probably doesn’t sound like a lot, and I suppose it isn’t; but the UN poverty threshold is $2 per person per day, which is $730 per person per day. Thus, our basic income is over four times what it would take to eliminate global poverty by the UN threshold.

Now in fact I think that this threshold is probably too low; but is it four times too low? We are accustomed to such a high standard of living in the First World that it’s easy to forget that people manage to survive on far, far less than we have. I think in fact our problem here is not so much poverty per se as it is inequality and financial insecurity. We live in a state of “insecure affluence”; we have a great deal (think for a moment about your shelter, transportation, computer, television, running water, reliable electricity, abundant food—and if you are reading this you probably have all these things), but we constantly fear that we may lose it at any moment, and not without reason. (My family actually lost the house I grew up in as a result of predatory banking and the financial crisis.) We are taught all our lives that the only way to protect this abundance is by means of a hyper-competitive, winner-takes-allcutthroat capitalist economy that never lets us ever become comfortable in appreciating that abundance, for it could be taken from us at any time.

I think the apotheosis of what it is to live in insecure affluence is renting an apartment in LA or New York—you must have a great deal going for you to be able to live in the city at all, but you are a renter, an interloper; the apartment, like so much of your existence, is never fully secure, never fully yours. Perhaps the icing on the cake is if you’re doing it for grad school (as I was a year ago), this bizarre system in which we live near poverty for several years not in spite but because of the fact that we are so hard-working, intelligent and educated. (And it never ceases to baffle me that economists who lived through that can still believe in the Life-Cycle Spending Hypothesis.)

Being below the poverty line in a First World country is a kind of poverty, but it’s a very different kind than being below the poverty line in a Third World country. (I think we need a new term to distinguish it, and maybe “insecure affluence” or “economic insecurity” is the right one.) A national basic income could be set considerably higher than the global basic income (since we’re giving it to far fewer people), so we might actually be able to set $15,000 nationally—but to do that worldwide would use up literally all the money in the world.

Raising the minimum income worldwide to $3,000 per person per year would transform the lives of billions of people. It would, in a very real sense, end poverty, worldwide, immediately and forever.

And that’s the good news. Stay tuned for the bad news.